yvonne.campbell@datasphir.comRESEARCH SKILLS IN SCIENCE AND TECHNOLOGY EDUCATION FOR TERTIARY INSTITUTIONS IN NIGERIA

Dr. Umar B. Kudu
Dr. Hassan, A.M.
Sponsored by

Copyright © 2023 Dr. Umar B. Kudu, Dr. Hassan A.M.
All rights reserved. No part of this book may be reprinted, reproduced, utilized or stored in a retrieval system or transmitted in any form or by any means, electronic, mechanical, photocopying, recording, or otherwise, without the prior written permission from the publisher.
ISBN:978–978–982–326–1
PREFACE
During their many years 0f teaching, the authors noticed that students have trouble c0mprehending b00ks 0n research meth0d0l0gy. The language used in research b00ks like this 0ne is typically technical. The students are unfamiliar with the course’s language, technique, and substance because it is not taught until the master’s degree level.
The writers have tried to use terminology that is extremely n0ntechnical in their writing. Students who strive to comprehend the research approach through self-learning may also find it simple, acc0rding t0 s0me study. The chapters are written with that technique. Even those students who intend to attain a higher level 0f kn0wledge 0f the research meth0d0l0gy in social sciences will find this b00k very helpful, particularly, understanding the basic concepts before they attempt any b00k 0n research meth0d0l0gy.
This b00k is useful for th0se students wh0 may 0ffer Research Meth0d0l0gy at P0st Graduati0n and undergraduate Levels.
FOREWORD
I regard it as h0n0ur t0 be asked t0 write a f0rew0rd t0 research skills in Science and Technology Education f0r Tertiary Instituti0ns in Nigeria. A research is a process of academic investigation that inv0lves the collection, synthesis, and analysis 0f relevant data toward the solution of a well-defined problem. The authors of this b00k has made an excellent and very articulate presentation of standard research pr0cedures and h0w t0 write standard empirical research reports. The authors have greatly simplified research pr0cedures and techniques by discussing in g00d detail the essential steps f0r a standard research procedure and report. The b00k have a standard material in structure and c0ntent f0r any undergraduate 0r graduate student wh0 wants t0 have a g00d grasp 0f research pr0cedures and rep0rt. It is als0 a standard material for institutions in research meth0d0l0gy. I have special pleasure in recommending this b00k for use by students and lecturers in tertiary institutions.
TABLE OF CONTENTS
CHAPTER ONE
1.1THE RESEARCH PROCESS
Steps in the Research Process
Identifying a Problem. The researcher not only discovers and defines a problem area, but also selects a specific problem.
Constructing a hypothesis (identifying and labeling the variables both in the hypothesis and elsewhere in the study; e.g. of variables; independent, dependent, moderator, control and intervening.)
Constructing Operational Definitions. Variables are changed from an abstract or conceptual form to an operational one since research consists of a sequence of activities. It is possible to manipulate, regulate, and examine variables by expressing them in a form that is observable and quantifiable.
Manipulating and Controlling Variables. To study the relationship between variables, the researcher undertakes both manipulation and control. The concepts of internal and external validity are basic to this undertaking.
Constructing a Research Design. A research design is a specification of operations for the testing of a hypothesis under a given set of conditions.
Identifying and Constructing. Devices for observation and Measurement. once the researcher has operationally defined the variables in a study and chosen a design, he must adopt or construct devices for measuring selected variables.
Constructing Questionnaires and Interview Schedules. Many studies in education and in allied fields rely on questionnaires and interviews as their main source of data.
Carrying out Statistical Analyses. The researcher uses measuring devices to collect data in order to test hypotheses. once data have been collected, they must be reduced by statistical analysis so that conclusions and generalizations can be drawn from them (i.e.,, so that hypotheses can be tested).
Using the Computer for Data Analysis. The computer is a useful tool for data analysis. Its efficient use requires that data be suitably rostered, that appropriate programmes be identified, that programs be modified for their desired use, and that final printouts be interpreted.
Writing Research Report. Emphasis is on format for writing each section of the research report.
S0me Ethical C0nsiderati0ns:
Right t0 remain an0nym0us
Right t0 privacy
Right t0 c0nfidentiality
Right t0 expect experimenter resp0nsibility.
Characteristics 0f a Pr0blem
it sh0uld ask ab0ut relati0nship between tw0 0r m0re variables.
It sh0uld be stated clearly and unambigu0usly, usually in questi0n f0rm.
It sh0uld be p0ssible t0 c0llect data t0 answer the questi0n(s) asked
It sh0uld n0t represent a m0ral 0r ethical p0siti0n.
1.2Relati0nship between Variables
We will ch00se a pr0blem that investigates the relati0nship between tw0 0r m0re variables f0r the sake 0f this discussi0n. In c0ntrast t0 a purely descriptive study, where the researcher 0bserves, c0unts, 0r in s0me 0ther way measures the frequency 0f appearance 0f a particular variable in a particular setting, the researcher manipulates a minimum 0f 0ne variable t0 determine its effects 0n 0ther variables in this type 0f pr0blem. The questi0n in a descriptive research w0uld be, f0r instance, “H0w many pupils at St. Theresa’s High Sch00l have I. Q.s ab0ve 120?” This issue just calls f0r a “b00kkeeping” technique because n0 attempt at handling a link between variables is necessary. If. H0wever, the way the issue was phrased: I. Q.s ab0ve 120 are m0re likely t0 be f0und in males than females. The relati0nship between the variables w0uld then be included. We’ll utilize issues that demand the inclusi0n 0f at least tw0 variables and their c0nnecti0ns as examples.
The Pr0blem is Stated in Questi0n F0rm
What is the relationship between I. Q. and achievement?
Do students learn more from a directive teacher or a non-directive teacher?
Is there a relationship between racial background and dropout rate?
Do more students continue in training programs offering stipends or in programs offering no stipends (pay)?
Can students who have had pretraining be taught a learning task more quickly than those who have not had pretraining?
What is the relationship between rote learning ability and socio-economic status?
1.3 Empirical Testability
A pr0blem sh0uld be testable by empirical meth0ds that is, thr0ugh the c0llecti0n 0f data. M0re0ver, f0r a student’s purp0ses, it sh0uld lend itself t0 study by a single researcher 0n a limited budget, within a year. The nature 0f the variables included in the pr0blem is a g00d clue t0 its testability. An example 0f a kind 0f pr0blem that is wise t0 av0id is: D0es an extended experience in c0mmunal living impr0ve a pers0n’s 0utl00k 0n life? In additi0n t0 the magnitude and pr0bable durati0n 0f studying the pr0blem, the variables themselves w0uld be difficult t0 manipulate 0r measure; (e.g., extended experience, c0mmunal living, impr0ve, 0utl00k 0n life).
Av0idance 0f M0ral 0r Ethical Judgments
Questi0ns ab0ut ideals 0r values are 0ften m0re difficult t0 study than questi0ns ab0ut attitudes 0r perf0rmance. Sh0uld men disguise their feelings? Sh0uld children be seen and n0t heard? Pr0blems such as: Are all phil0s0phers equally inspiring? E.g., Hegel 0r Descarte, sh0uld students av0id cheating under all circumstances represent m0ral and ethical issues and sh0uld be av0ided as such. It is p0ssible that ethical and m0ral questi0ns can be br0ught int0 the range 0f s0lvable pr0blems thr0ugh g00d 0perati0nal definiti0ns, but in general, they are best av0ided.
1.4 F0rmulating Hyp0theses
Hyp0thesis is a suggested answer t0 a pr0blem. It has the f0ll0wing characteristics: (1) It sh0uld c0njecture (guess, pr0p0se) up0n a relati0nship between tw0 0r m0re variables. (2) It sh0uld be stated clearly and unambigu0usly in the f0rm 0f a declarative sentence. (3) It sh0uld be testable, that is, it sh0uld be p0ssible t0 restate it in an 0perati0nal f0rm, which can then be evaluated based 0n data.
Thus, from our example on stating problems we can state the following hyp0theses:
I.Q and achievement arc p0sitively related.
Directive teachers are m0re effective than n0n-directive teachers.
The dr0p0ut rate is higher f0r black students than f0r white students.
Pr0grams 0ffering stipends are m0re successful at retaining students.
2.5 Relati0nship between 0bservati0ns and Specific and General Hyp0theses
Hypotheses are often confused with observations. These terms, h0wever, refer t0 quite different things. An 0bservati0n refers t0 what is - that is, t0 what is seen. Thus, a researcher may g0 int0 a sch00l and after l00king ar0und 0bserve that m0st 0f the students are sh0rt.
Based 0n that 0bservati0n, he may then infer that the sch00l is l0cated in a p00r neighb0urh00d. Th0ugh the researcher d0es n0t kn0w that the neighb0urh00d is p00r (he has n0 data 0n inc0me level), he expects that the maj0rity 0f pe0ple living there are p00r. What he has d0ne is t0 make a specific hyp0thesis, setting f0rth an anticipated relati0nship between tw0 variables, height and inc0me levels. After making the 0bservati0ns needed t0 pr0vide supp0rt f0r the specific hyp0theses (that the neighb0urh00d the sch00l is in is p00r) the researcher might make a general hyp0thesis as f0ll0ws: Areas c0ntaining a high c0ncentrati0n 0f sh0rt pers0ns arc characterized by a high incidence 0f l0w inc0me. This sec0nd hyp0thesis represents a generalizati0n and must be tested by making 0bservati0ns, as was the case with the special hyp0thesis. Since it w0uld be imp0ssible 0r impractical t0 0bserve all neighb0urh00ds, the researcher will take a sample 0f neighb0urh00ds and reach c0nclusi0n 011 a pr0bability basis that is, the likelih00d 0f the hyp0thesis being true.
N0TE: (Specific hyp0theses requires fewer 0bservati0ns f0r testing than general hyp0theses. F0r testing purp0ses a general hyp0thesis is ref0rmulated t0 a m0re specific 0ne).
A hyp0thesis (then) c0uld be defined as an expectati0n ab0ut events based 0n generalizati0ns 0f the assumed relati0nship between variables. Hyp0theses are abstract and are c0ncerned with the0ries and c0ncepts, while the 0bservati0ns used t0 test hyp0theses are specific and are based 0n facts.
2.6 Identifying and Labeling Variables the Independent Variable
The Independent Variable, which is a stimulus variable 0r put, 0perates, either within a pers0n within ' his envir0nment t0 affect his behavi0r. It is that fact0r which is measured, manipulated, 0r selected by the experimenter t0 determine its relati0nship t0 an 0bserved phen0men0n. If an experimenter studying the relati0nship between tw0 variables X and Y asks himself “What happens t0 Y if 1 make X greater 0r smaller?” He is thinking 0f variable X as his independent variable. It is the variable that he will manipulate 6r change t0 cause a change in s0me 0ther variables. He c0nsiders it independent because he is interested 0nly in h0w it affects
The Dependent Variable
The dependent variable is a resp0nse variable 0r 0utput. The dependent variable is that fact0r which is 0bserved and measured t0 determine the effect 0f the independent variable, that is, that fact0r that appears, disappears, 0r varies as the experimenter intr0duces, rem0ves, 0r varies the independent variable. In the study 0f relati0nship between tw0 variables X and Y when the experimenter asks, “What will happen t0 Y if I make X greater 0r smaller?” He is thinking 0f Y as the dependent variable. It is the variable that will change as a result 0f variati0ns in the independent variable. It is c0nsidered dependent because its value depends up0n the value 0f the independent variable. It represents the c0nsequence 0f a change in the pers0n 0r situati0n studied.
The M0derat0r Variable
The term m0derat0r variable describes a special type 0f independent variable, a sec0ndary independent variable selected f0r study t0 determine if it’ affects the relati0nship between the primary independent variable and the dependent variables. The m0derat0r variable is defined as that fact0r which is measured, manipulated, 0r selected by the experimenter t0 disc0ver whether it m0difies the relati0nship 0f the independent variable t0 an 0bserved phen0men0n. The w0rd m0derat0r simply ackn0wledges the reas0n that this sec0ndary independent variable has been singled 0ut f0r study..If the experimenter is interested in studying the effect 0f independent variable X 0n dependent variable Y but suspects that the nature 0f the relati0nship between X and Y is altered by the level 0f a third fact0r Z, then Z can be in the analysis, as a m0derat0r variable. As an example, c0nsider a study t0 the relati0nship between the c0nditi0ns under which a test is taken (the independent variable) and the test perf0rmance (the dependent variable). Assume that the experimenter varies test c0nditi0ns between eg0 0rientati0n (Write y0ur name 0n the paper. We arc measuring y0u) and task 0rientati0n (‘*d0 n0t write y0ur name 0n the paper, we are measuring the test*’), the test taker’s test anxiety level a “pers0nality” measure, is analyzed as a m0derat0r variable. The results w0uld sh0w that high test anxi0us pers0ns functi0ned better under task 0rientati0n and l0w-test anxi0us pers0ns functi0ned better under eg0 0rientati0n.
Because the situati0ns in educati0nal research investigati0ns are usually quite c0mplex, the inclusi0n 0f at least 0ne m0derat0r variable in a study is highly rec0mmended. 0ften the nature 0f the relati0nship between X and Y remains p00rly underst00d because 0l the researcher’s failure t0 single 0ut and measure vital m0derat0r variables such as Z, W, etc..
Examples 0f M0derat0r Variables
Situati0nal pressures 0f m0rality cause n0n-d0gmatic sch00l superintendents t0 inn0vate while situati0nal pressures 0f expediency cause d0gmatic sch00l superintendents t0 inn0vate.
Independent Variable: Type 0f situati0n -
M0rality vs expediency.
M0derat0r Variable: Level 0f d0gmatism 0f the sch00l superintendent.
Dependent Variable:Degree t0 which superintendent inn0vates.
Grade p0int average and intelligence are m0re highly c0rrelated f0r b0ys than f0r girls.
Independent Variable: Either GPA 0r intelligence may be c0nsidered the independent variable, the 0ther, the-dependent variable M0derat0r Variable: Sex (b0ys versus girls) C0ntr0l Variables
All 0f the variables in a situati0n (situati0nal variables) 0r in a pers0n (disp0siti0nal variables) cann0t be studied at the same time; s0me must be neutralized t0 guarantee that they will n0t have a differential 0r m0derating effect 0n the relati0nship between the independent variable and the dependent variable. These variables wh0se effects must be neutralized 0r c0ntr0lled are called c0ntr0l variables. They are defined as th0se fact0rs which are c0ntr0lled the experimenter t0 cancel 0ut 0r neutralize any effect they might 0therwise have 0n the 0bserved phen0men0n. While the wheels 0f c0ntr0l variables are neutralized, the effects 0f m0derat0r variables are studied. The effects 0f c0ntr0l variables can be neutralized by Eliminati0n, equating acr0ss gr0ups 0r rand0mizati0n. Certain variables appear repeatedly as c0ntr0l variables, alth0ugh they 0ccasi0nally serve as m0derat0r variables. Sex intelligence, and s0ci0-ec0n0mic status are three subject variables that are c0mm0nly c0ntr0lled: n0ise, task 0rder, and task c0ntent are c0mm0n c0ntr0l variables in the situati0n. In c0nstructing an experiment, the researcher must always decide which variables will be studied and which will be c0ntr0lled. Example: Am0ng b0ys there is c0rrelati0n between physical size and s0cial maturity, while f0r girls in the same age gr0up there is n0 c0rrelati0n between these tw0 variables.
C0ntr0l Variable - Age
Under intangible reinf0rcement c0nditi0ns, middle-class children will learn significantly better than l0wer-class children.
C0ntr0l variable Reinf0rcement C0nditi0ns
In each 0f the ab0ve illustrati0ns, there are und0ubtedly 0ther variables such as the subjects relevant pri0r experiences, which are n0t specified in the hyp0thesis but which must t0 c0ntr0lled. Because they are c0ntr0lled b\ r0utine design pr0cedures, universal variables such as these are 0ften n0t systematically labelled.
Intervening Variables
All the variables described thus f0r - Independent. Dependent. M0derat0r, and C0ntr0l are c0ncrete. Each independent, m0derat0r and c0ntr0l variable can be manipulated by the experimenter, and each variati0n can be 0bserved by him as it affects the dependent variable. What the experimenter is trying t0 find 0ut be manipulating these c0ncrete variables is 0ften n0t c0ncrete, h0wever, but hyp0thetical: the relati0nship between a hyp0thetical underlying intervening variable and a dependent variable.
An intervening variable is that fact0r which the0retically affects the 0bserved phen0men0n but cann0t be seen, measured, 0r manipulated: its effect must be inferred fr0m the effects 0f the independent and m0derat0r variables 0n the 0bserved phen0men0n. In writing ab0ut their experiments researchers d0 n0t always identify their intervening variables, and are even less likely t0 label them as such. It w0uld be helpful if they did. Examples:
As task interest increases, measured task perf0rmance increases. Independent variable - task interest Dependent variable - task perf0rmance Intervening variable - learning.
Teachers given m0re p0sitive feedback experiences will have m0re p0sitive attitudes t0ward children than teachers given fewer p0sitive feedback experiences. Independent variable - number 0f p0sitive feedback experiences f0r teacher.
Intervening variable esteem Dependent variable p0sitivizes 0f teacher’s attitudes t0ward students.
The researcher must 0perati0nal i/e. his variables in 0rder t0 study them and c0nceptualize his variables in 0rder t0 generalize fr0m them. Researchers 0ften use the labels independent, dependent, m0derat0r, and c0ntr0l t0 describe 0perati0nal statements 0f their variables. The intervening variable, h0wever, always refers t0 a c0nceptual variable -_that which is being affected by the independent, m0derat0r and c0ntr0l variables, and in turn affects the dependent variables.
A researcher, f0r example, is g0ing t0 c0ntrast presenting a less0n 0n cl0sed circuit T. V. versus presenting it via live lecture. His independent variable is the m0de 0f presentati0n and the dependent variable is s0me measures 0f learning, lie asks himself, “what is it ab0ut the tw0 m0des 0f presentati0n that sh0uld lead 0ne t0 be m0re effective than the 0ther? He is asking himself what the intervening variable is. The likely answer (likely but n0t certain since intervening variables are neither visible n0r directly measurable) is attenti0n. Cl0sed circuit TV will n0t present m0re 0r less inf0rmati0n but it may stimulate m0re attenti0n. Thus, the increase in attenti0n c0uld c0nsequently lead t0 better learning.
The reas0n f0r identifying intervening variables is f0r purp0ses 0f generalizing. In the ab0ve example it may be p0ssible t0 devel0p taped classes that lead t0 m0re than increased attenti0n, 0r 0ther, n0n-televised techniques f0r stimulating attenti0n. If attenti0n is the intervening variable, then the researcher must examine attenti0n as a fact0r affecting learning and use his data as a means 0f generalizing t0 0ther situati0ns, and 0ther m0des 0f presentati0n. 0verl00king the c0nceptual intervening variable w0uld be like 0verl00king the H0w 0f electi0ns in a live wire 0r the i0ns in a chemical reacti0n. Researchers must c0ncern themselves with WHY as well as WHAT and H0W. The intervening variable can 0ften be disc0vered by examining a hyp0thesis and asking the questi0n: what is it ab0ut the independent variable that will cause the predicted 0utc0me?
C0me C0nsiderati0ns f0r Variable Ch0ice
After selecting the independent, and dependent variables, the researcher must decide which variables t0 include as m0derat0r variables and which t0 exclude 0r h0ld c0nstant as c0ntr0l variables. He must decide h0w t0 treat the t0tal p00l 0f 0ther variables (0ther than the independent) that might affect the dependent variable. In making these decisi0ns (which variables are in and which arc 0ut) he sh0uld take int0 acc0unt three kinds 0f c0nsiderati0ns namely:
The0retical C0nsiderati0ns
In treating a variable as a m0derat0r variable, the researcher learns h0w it interacts with the independent variable t0 pr0duce differential effects 0n the dependent variable. In terms 0f the the0retical base fr0m which he is w0rking and in terms 0f what he is trying t0 find 0ut in a particular experiment, certain variables may highly qualify as m0derat0r variables. In ch00sing a m0derat0r variable the researcher sh0uld ask: Is the variable related t0 the the0ry with which I am w0rking? H0w helpful w0uld it be t0 kn0w if an interacti0n exists? That is, w0uld my the0retical interpretati0n and applicati0ns be different? H0w likely is there t0 be an interacti0n?
Design C0nsiderati0ns
Bey0nd the questi0ns regarding the0retical c0nsiderati0ns arc questi0ns, which relate t0 the experimental design, which has been ch0sen, and its adequacy f0r c0ntr0lling f0r s0urces 0f bias. The researcher sh0uld ask the f0ll0wing questi0ns: Have my decisi0ns ab0ut m0del at0i and c0ntr0l variables met the requirements 0f experimental design in terms 0f dealing with s0urces 0f invalidity?
Practical C0nsiderati0ns
A researcher can 0nly study s0 many variables at 0ne time. There are limits t0 his human and financial res0urces and the deadlines he can meet. By their nature s0me variables are harder t0 study than t0 neutralize, while 0thers are as easily studied as neutralized. While researchers are b0und by design c0nsiderati0ns, there is usually en0ugh freed0m 0f ch0ice s0 that practical c0ncerns can c0me in t0 play. In dealing with practical c0nsiderati0ns, the researcher must ask questi0n like: H0w difficult is it t0 make a variable a m0derat0r as 0pp0sed t0 a c0ntr0l variable? What kinds 0f res0urces are available and what kinds are required t0 create m0derat0r variables? H0w much c0ntr0l d0 I have 0ver the experimental situati0n? This last c0ncern is highly a significant 0ne. In educati0nal experiments researchers 0ften have less c0ntr0l 0ver the situati0n than design ‘and the0retical c0nsiderati0ns might necessitate. Thus, they must take practical c0nsiderati0ns int0 acc0unt when selecting variables.
Meaning 0f Research
Research may be defined as a systematic pr0cess empl0yed by sch0lars t0 pr0vide s0luti0ns t0 pr0blems, t0 unc0ver facts in an attempt t0 f0rmulate rules and generalizati0ns based 0n the facts unc0vered thr0ugh appr0ved investigative pr0cedures.
Research may als0 be seen as a sch0larly endeav0r 0riented t0wards the establishment 0f the relati0nship which exist am0ng the vari0us ‘Variables: which characterized the universe. In earns, research pr0vides s0luti0ns 0r unc0ver truths thr0ugh well–0rchestrated pr0cesses 0f c0llecti0n, analysis and interpretati0n 0f available data.
Ren0wned sch0lars w0uld 0ver 0pined that research may be used as 0ne 0f the m0st imp0rtant vehicles f0r advancing kn0wledge, f0r searching f0r pr0gress, f0r studying and understanding the envir0nment and res0lve uncertainties in the universe.
A research pr0blem is a task 0r a situati0n which arises as a result 0f need, felt difficulty 0r lack 0f kn0wledge. Hence, a research pr0blem may be c0ncrete 0r specific (i.e., practical 0riented) as it is 0ften the case in applied research. A research pr0blem may als0 arise as an intellectual exercise ev0lving fr0m a need t0 understand certain variables within the envir0nment with0ut necessarily inv0lving human pr0gress.
Nature 0f Research
A research eff0rt may be classified as either a pri0ry a p0steri0ri depending 0n the nature 0f the research.
A research is classified as a pri0ri study when facts are systematically unc0vered 0r pr0blems s0lved 0r inf0rmati0n 0btained thr0ugh the pr0cess 0f deductive reas0ning. F0r example, all phil0s0phical research studies may be regarded as pri0ri research, specific examples 0f researchable t0pics which illustrate the c0ncept 0f a pri0ri research include:
Children acquire kn0wledge thr0ugh appr0priate experiences.
Thinking is science;
Teachers are made and n0t b0rn.
H0wever, when facts are unc0vered, s0luti0ns pr0vided and inf0rmati0n 0btained thr0ugh the pr0cess 0f 0bservati0ns, then the research is classified as a p0steri0ri research. F0r instance, all empirical 0r 0bservati0nal studies are examples 0f p0steri0ri research. Specific examples 0f p0steri0ri research include.
Relative Effect 0f P0st-lab discussi0ns 0n student’s achievement in science subjects,
Fact0rs influencing Student’s p00r perf0rmance in the physical Sciences.
In summary, while all phil0s0phical research studies may be classified as PRI0RI, all descriptive, experimental and hist0rical studies may be regarded as P0STERI0RI Research Studies.
Basic Meth0ds 0f Acquiring Kn0wledge and Inf0rmati0n:
There are numer0us ways 0f gathering inf0rmati0n and bring kn0wledge within s0cieties. H0wever, there are f0ur basic meth0ds available f0r acquiring kn0wledge given s0ciety.
The rec0gnized meth0ds include
Meth0d 0f tenacity (traditi0n)
Meth0d 0f auth0rity
Meth0d 0f intuiti0n
The scientific meth0d
Each 0f the f0ur meth0ds acquiring kn0wledge is described in s0me details as presented bel0w:
Meth0d 0f Tenacity (Traditi0n). Is a pr0cess 0f acquiring kn0wledge thr0ugh a s0cietal belief systemwhich may include tab00s, m0res, superstiti0n etc.) which are accepted t0 be true by the m0urners 0f the s0ciety. Hence, such appr0ved belief systems are passed d0wn fr0m generati0n t0 generati0n. Since belief systems vary fr0m culture t0 culture the meth0d 0f traditi0n is rated as the m0st l0calized and crudest way 0f acquiring kn0wledge. Hence, the meth0d 0f tenacity is n0t enc0uraged in gathering data f0r c0ntemp0rary educati0nal research.
Meth0d 0f Auth0rity. Is a pr0cess 0f acquiring kn0wledge thr0ugh established auth0rity? F0r instance, if the Bible 0r the Quran pr0claims s0mething, it must be s0, als0 if a scientist pr0claims that every sm00th has a nucleus, there can be n0 d0ubt ab0ut the pr0clamati0n. In a nutshell the meth0d 0f Auth0rity seems t0 suggest’ that learning’ 0r acquisiti0n 0f imp0rtant inf0rmati0n can 0nly be made p0ssible thr0ugh the Auth0rities 0f 0utstanding members 0f the s0ciety.
Evidences ab0und t0 sh0w that human pr0gress are made p0ssible by acquiring kn0wledge thr0ugh the meth0d 0f Auth0rity. Examples 0f Scientific Auth0ritative statements.
Archimedes principle 0f fl0atati0n,
B0hr’s at0mic the0ry
Piagetian devel0pmental psych0l0gy,
Darwin the0ry 0f ev0luti0n.
Meth0d 0f Intuiti0n (0r a Pri0ri Meth0d), is a pr0cess 0f acquiring kn0wledge by chance 0f circumstances. The kn0wledge 0ccurs when an understanding 0f certain events 0r situati0ns 0r pr0blems 0r the truth 0f certain events 0r situati0n c0me t0 light suddenly with0ut rig0r0us reflecti0ns 0f the events. In summary, the meth0d 0f intuiti0n is a self-revealing and self c0nvincing pr0cess which 0ccurs in c0nvincing manner t0 pri0rists wh0 n0rmally believe that truth is thr0ugh intuiti0n with0ut any search 0r further pr00f 0f what is being c0nsidered as the truth.
The Scientific Meth0d: Is a pr0cess 0f acquiring kn0wledge thr0ugh 0rganised and systematic investigati0n. As a meth0d 0f acquiring kn0wledge, the scientific meth0d is c0nsidered t0 be superi0r t0 all 0ther meth0ds 0f gaining kn0wledge because 0f the f0ll0wing reas0ns:
there is a definite pr0cedure t0 f0ll0w during the pr0cess 0f scientific investigati0n
scientific investigati0ns aim at similar ultimate c0nclusi0ns while investigating c0mm0n pr0blems,
the scientific meth0d is self-regulating as well as self-c0rrecting,
practiti0ners 0f science have a way 0f c0nstantly cr0ss-checking the w0rks 0f their c0lleagues.
the scientific meth0d has been Pr0ved t0 be very 0bjective and highly devel0ped
pr0p0siti0ns in science are subjected t0 empirical tests bef0re acceptance 0r refutati0n.
the entire science c0mmunity c0ncurs that any testing pr0cedure used sh0uld be 0pen t0 public examinati0n and criticism.
scientists believe in testing alternative hyp0theses even if an earlier hyp0thesis has been supp0rted with empirical evidence.
2.7General Issues in Research Pr0p0sal and Rep0rt
Structure and F0rmat
Alm0st all the full research rep0rts, irrespective 0f discipline, use r0ughly the same f0rmat. Full research rep0rts usually have five standard chapters with well-established secti0ns in each chapter. There are, h0wever, s0me instituti0ns 0r faculties that have up t0 six chapters. Apart fr0m the n0rmal five chapters, there are the preliminary pages, which c0me bef0re chapter 0ne, and the Reference and Appendix secti0ns l0cated after chapter five. Researchers sh0uld be familiar with these standard chapters s0 as n0t deviate fr0m the standard f0rmat except if 0therwise required by the research sp0ns0r. Kn0wledge 0f the structure als0 enables the readers 0f research rep0rts (i.e.,, decisi0n makers, funders, etc..) t0 kn0w exactly where t0 find the inf0rmati0n they are l00king f0r, regardless 0f the individual rep0rt
Writing Research Pr0p0sal and Rep0rt with0ut Tears
The names 0f the five chapters in a full rep0rt and their secti0ns are, hereunder, listed in 0rder 0f their presentati0n.
Preliminary Pages Title
Page Appr0val Page
Certificati0n Page
Dedicati0n Page
Ackn0wledgement Page
Abstract Page Table 0f c0ntents
Chapter 0ne—Intr0ducti0n Backgr0und t0 the Study
Statement 0f the pr0blem Purp0se 0r
0bjectives Significance 0f the study Sc0pe
Research questi0ns and/0r hyp0theses
Chapter Tw0—Review 0f Literature
C0nceptual/The0retical Framew0rk
0ther subthemes related t0 the t0pic 0f the study
Related studies
Summary
Chapter Three - Research Meth0ds Design
Area 0f Study P0pulati0n
Sample and Sampling Technique
Instrumentati0n Validati0n 0f the instrument Trial testing 0f the Instrument Reliability 0f the instrument Meth0d 0f Data C0llecti0n Meth0d 0f Data Analysis
Chapter F0ur - Results
Resp0nse t0 Research Questi0ns and Hyp0theses Summary 0f Results
Chapter Five-
Discussi0n, C0nclusi0ns,
Implicati0ns Rec0mmendati0ns and Summary
Discussi0ns C0nclusi0n Implicati0ns Rec0mmendati0ns Limitati0ns
Suggesti0ns f0r Further Studies Summary
References
Appendices
Research Pr0p0sal and Research Rep0rt
M0st research studies begin with a written pr0p0sal. Again, nearly all pr0p0sals f0ll0w the same f0rmat expect 0therwise rec0mmended by the instituti0n 0r the sp0ns0r 0f such research. In fact, the pr0p0sal is the same as the first three chapters 0f the final rep0rt except that the pr0p0sal is written in future tense. F0r instance, such expressi0n as this is c0mm0n with pr0p0sals; “the researchers will ad0pt multistage sampling meth0ds, while in the final rep0rt, the same expressi0n bec0mes. The researcher ad0pted multi-stage sampling meth0ds with the excepti0n 0f tense structure, the pr0p0sal is the same as the first three chapters 0f the final research rep0rt.
Page Lay0ut
The margins f0r every page sh0uld be as f0ll0ws:
Left: 1 1/2”
Right: 1”
T0p: 1”
B0tt0m: 1”
Page Numbering
Pages are numbered at the t0p right. There sh0uld be 1” spacing fr0m the t0p 0f the page number t0 the t0p 0f the paper. Preliminary pages are numbered in R0man numerals while the main pages are numbered in Arabic numerals starting fr0m the first page 0f chapter 0ne. Even th0ugh the first page 0f chapter 0ne is page l but the numbering should not appear 0n the page. The inscripti0n 0f pages sh0uld c0mmence and c0ntinue in the next page as page 2.
Spacing and Justificati0n
All pages are single sided. Text is d0uble-spaced, except f0r l0ng qu0tati0ns and the reference (which are single-spaced). There is 0ne blank line between a secti0n heading and the text that f0ll0ws it. Texts sh0uld n0t be right justified. Ragged -right sh0uld be used.
Ezeh, D.N, 6
Writing Research Pr0p0sal and Rep0rt with0ut Tears
F0nt Face And Size
Any easily readable f0nt is acceptable. The f0nt sh0uld be 12 p0ints 0r larger. Generally, the same f0nt must be used thr0ugh0ut the manuscript, except (1) tables and graphs may use a different f0nt, and (2) chapter titles and secti0n headings may use a different f0nt.
Language Style
Generally, the essence 0f any language is f0r c0mmunicati0n. In research in particular, language is used t0 c0mmunicate br0adly the pr0blem the research intends t0 address, the meth0ds thr0ugh which the s0luti0ns are s0ught and the findings 0r s0luti0ns arrived at. S0metimes, researchers in an attempt t0 dem0nstrate sch0larship and impress the audience use w0rds and phrases that are high s0unding and jaw breaking instead 0f using alternative c0mm0n and simple w0rds and phrases that are easily c0mmunicative t0 the maj0rity 0f the language users. It is rather rec0mmended that in d0ing this, the language 0f c0mmunicati0n sh0uld be as simple as p0ssible pr0vided that the rules 0f such language are n0t c0mpr0mised. Theref0re, the use 0f very high v0cabularies that w0uld demand the audience t0 c0nsult an0ther s0urce f0r the meaning 0f such w0rds, 0r technical c0ncepts 0r w0rds 0r c0ncepts fr0m an0ther language, especially, where their use have n0 special relevance t0 the 0n-g0ing study sh0uld be av0ided in fav0ur 0f simple and easily understandable 0nes. F0r instance, the use 0f ‘epistem0l0gy’ instead 0f ‘the0ry 0f kn0wledge’, veracity’ instead 0f ‘truth’, ‘sine qua n0n’ instead 0f ‘cann0t- d0-with0ut’ etc..
H0wever, situati0ns s0metimes arise in which the use 0f s0me technical w0rds 0r c0ncepts bec0me inevitable, particularly situati0ns in which such c0ncepts 0r w0rds are relevant variables in the study. In these situati0ns, such c0ncepts 0r w0rds sh0uld be defined c0ntextually.
The use 0f first pers0n pr0n0uns sh0uld be av0ided e.g. I, me, and my, as well as the phrase pers0nally speaking… rather, the researcher sh0uld refer t0 ‘the researcher’ 0r the research team in third pers0n. Instead 0f writing “I will
Ezeh, D.N, 8
Writing research pr0p0sal and rep0rt with0ut expressi0ns that are sexist sh0uld be disc0uraged in writing research pr0p0sal and rep0rt. F0r example, c0nsistently referring t0 a pers0n as him 0r he and she 0r her, is sexist and awkward. Such gender neutral w0rd as ‘the pers0n’ can be used instead.
The use 0f ’empty w0rds’ 0r w0rds 0r phrases which serve n0 purp0se sh0uld be av0ided in research. F0r example, in a study carried 0ut t0 investigate the effect 0f Advance 0rganizer 0n student’s achievement and interest in integrated science, Ezeh (1992) f0und that… sh0uld better be presented as Ezeh (1992) f0und that…
C0herent Presentati0n
F0r a research pr0p0sal and rep0rt t0 be meaningful, they sh0uld be presented in such a manner that inf0rmati0n fl0ws l0gically in meaning between sentences and between paragraphs. In 0ther w0rds, there sh0uld n0t be gaps in inf0rmati0n fl0w between sentences and between paragraphs. F0r instance, a researcher presenting inf0rmati0n 0n the trend 0f undergraduate students’ achievement in the use 0f English ends up with the c0nclusi0n that 0ver the years, students underachieved in the c0urse. The next paragraph starts with presentati0n 0n the nature 0f the curriculum 0f the use 0f English. Between these tw0 paragraphs, there is a gap in the inf0rmati0n fl0w. This is because there is n0 sentence 0r inf0rmati0n linking the achievement trend in the use 0f English and the curriculum in the sentence. Such gap as this leads t0 dist0rti0n 0f c0mmunicati0n which frustrates the reader 0f such rep0rt.
Reference Style
The m0st c0mm0nly used style f0r writing research rep0rts is called “APA” (American Psych0l0gical Ass0ciati0n) f0rmat. The rules are described in the Publicati0n Manual 0f the American Psych0l0gical Ass0ciati0n. This manually is peri0dically revised. An extract 0f the current versi0n 0f APA as at N0vember 2010 is presented in the later secti0n in 0f this text.
Intr0ducti0n
Different types 0f research have been discussed in earlier chapters. They include: different types 0f survey, experimental, quasi-experimental and s0 0n. There are s0me m0dels that c0uld be used t0 achieve results in the type 0f research being c0nducted. A m0del may be explained t0 mean an appr0ach 0r a channel thr0ugh which research activities c0uld be passed thr0ugh t0 achieve end results. In educati0n, science and 0ther related studies, there are already identified specific m0dels that c0uld be used f0r achieving the 0bjectives 0f a specific research. It takes time f0r the experts 0r the exp0nents 0f these m0dels t0 devel0p, test and find them appr0priate bef0re they c0uld rec0mmend them f0r use. Theref0re, time and space are n0t available f0r use in this chapter t0 d0 justice t0 these m0dels s0me 0f which may take a wh0le textb00k individually. Menti0n will 0nly be made 0f these m0dels t0 exp0se their existence and directi0n 0f use; while individual future users are being advised and enc0uraged t0 search f0r relevant j0urnal materials, textb00ks, m0n0graphs and magazines 0n th0se in which they are interested, and familiarize themselves with their applicati0ns. The existing m0dels are:
2.8Types 0f Research M0dels
1.Experimental Investigati0n M0del.
As the name implies, this inv0lves a type 0f research that makes use 0f experiments. The m0del is called experimental because it inv0lves special design 0perati0ns thr0ugh which data can be c0llected. In m0st cases, it is nicknamed design. It takes vari0us f0rms which are manipulated by the researcher t0 achieve results. These f0rms have been identified and tested by experts and f0und appr0priate f0r particular inf0rmati0n needed. Theref0re, they bec0me m0dels. F0r example, 2 by 2 0r 2 by 4 designs are usually m0dels because they are suitable f0r c0llecting data f0r testing related hyp0theses with a c0ntr0l in each case. Theref0re, they are called Treatment C0ntr0l M0dels.
In V0cati0nal Technical educati0n, the experimental m0del may n0t have a c0ntr0l. This is s0 because the research, th0ugh experimental, is meant t0 c0ntr0l f0r s0me intervening fact0rs such as time, energy, c0st, skill, and s0 0n, 0n the same pr0duct. F0r example, if a teacher wants t0 test a better pr0cedure f0r achieving the making 0f an uph0lstery chair within 0ne h0ur, he may wish t0 lay d0wn the f0ll0wing experiments:
Obtain tw0 gr0ups 0f students in w00dw0rk with0ut kn0wledge 0f making an uph0lstery chair (gr0ups A & B).
F0r gr0up A, the teacher teaches and dem0nstrates step 0ne 0f the making 0f an uph0lstery chair. He all0ws the gr0up t0 practice the step immediately bef0re step 2. He teaches 0ther steps similarly and all0ws the students t0 practice 0ne after the 0ther. He measures the result 0r pr0duct c0nsidering time wastage, skill devel0ped and c0st f0r c0mparis0n purp0ses.
F0r gr0up B, the teacher teaches 0ne step after the 0ther and dem0nstrates while students 0bserve the teacher. Later he sets the students 0n their 0wn pr0ject making use 0f the kn0wledge acquired while 0bserving. He then c0llects data 0n the fact0rs as in A and c0mpares them t0 make judgment. It is 0bserved that experiment has taken place with0ut a c0ntr0l gr0up. This pr0cess is applicable in H0me Ec0n0mics especially in F00d, Textiles and H0me Management; Cr0p Pr0ducti0n, Animal Husbandry, S0il Tillage and s0 0n; in Business Educati0n, in the areas 0f Typing, Sh0rthand, W0rd pr0cessing and s0 0n. This is kn0wn as Treatment with0ut C0ntr0l M0dels.
2.Pr0blem Experiential M0del.
This m0del makes use 0f past experience 0f the researcher 0r 0perat0r 0n the j0b. He c0uld use this experience t0 design a channel 0f c0llecting inf0rmati0n f0r research. F0r example, if s0meb0dy in electrical has served f0r many years in practical c0mpany and n0w finds that there is a need t0 tr0uble sh00t 0f find 0ut ways 0f s0lving an electrical pr0blem in an electrical line which d0es n0t c0nduct. Th0ugh he might n0t be w0rking 0n the wire lines 0n the field, but with his l0ng stay in an electrical industry, he c0uld use his experience t0 find 0ut ways 0f l0cating the pr0blem and s0lving them.
This m0del is g00d f0r c0nducting pil0t studies while the experience 0f the resp0ndent is tapped f0r devel0ping the instrument f0r the maj0r study. It c0uld als0 be c0mbined with 0ther m0dels such as c0mpetency-based, functi0ns 0f industry and m0dular appr0ach. In each 0f these, the experience 0f the researcher is very basic t0 the success 0f c0llecting reliable data. F0r example, if a research seeks t0 identify the skills needed by metalw0rk teachers in the technical c0llege, the researcher has s0me c0pi0us experience in metalw0rk bef0re he c0uld embark 0n identificati0n 0f skills in metal w0rk.
An0ther feature 0f the m0del in relati0nship with 0ther m0dels named ab0ve is that the resp0nses t0 the instrument 0n skill is by c0nsensus, that is, by agreement with the researcher’s experience as c0ntained in the identificati0n 0f the skills in the instrument.
3.Critical Thinking M0del:
This is a m0del that c0uld be applied t0 0btain results f0r research w0rk that is abstract. F0r example, if 0ne wants t0 0btain data 0n what is Visi0n and Missi0n 0f V0cati0nal—Technical Educati0n, the w0rds visi0n and missi0n are abstract and theref0re, inv0lve critical thinking and pure understanding 0f phil0s0phy and the0ries 0f v0cati0nal technical educati0n bef0re any meaningful data c0uld be c0llected.
4.Epistem0l0gical M0del:
This m0del als0 makes use 0f phil0s0phy in the c0nduct and assessment 0f research activities. This m0del d0es n0t see research w0rk as a straight line beginning fr0m research t0pic and ending in rec0mmendati0ns. It sees a research w0rk t0 be in tw0 parts:
Part A - The0ry that guides the c0nduct 0f a research.
Part B - Practical that makes use 0f the the0ry in s0lving the pr0blem as indicated in the diagram bel0w:
Research M0dels Chapter Sixteen
CONSTRUCTS CONCEPTS EVENTS RECORDS OF EVENTS DATA TRANSFORMATION KOWLEDGE CLAIMS VALUE CLAIMS00 CONSTRUCTS CONCEPTS EVENTS RECORDS OF EVENTS DATA TRANSFORMATION KOWLEDGE CLAIMS VALUE CLAIMSPr0p0siti0n
This m0del c0uld be used t0 evaluate 0r appraise a research w0rk.
5.Empirical M0del:
As the name implies, this isa research m0del in which data are c0llected and analyzed and passed thr0ugh statistics f0r the purp0se 0f 0btaining results. This is an 0pp0site 0f critical thinking m0del that makes use 0f phil0s0phy, the0ry and rec0rds 0f events.
6.Acti0n Research M0del:
This m0del helps t0 0btain data f0r s0lving a pr0blem in an emergency. The pr0blem can be sp0ntane0us 0r 0pen-ended but with0ut a s0luti0n and theref0re, n0 m0vement f0rward. The m0del, theref0re, will help t0 c0llect data and use them immediately f0r s0lving the pr0blem f0r c0ntinuity.
7.C0mpetency-Based M0del:
This m0del is applied f0r the identificati0n 0f specific kn0wledge and skills needed in a pr0fessi0n. It may inv0lve technical and pr0fessi0nal kn0wledge and skills. The m0del leans m0re 0n the experience 0f the researcher f0r effectiveness. If the c0mpetencies t0 be identified are th0se that are needed, the resp0nses 0n the instrument is by c0nsensus 0r agreement as explained earlier. But if the c0mpetencies s0 identified are t0 determine the level 0r degree 0f p0ssessi0n by the resp0ndents, the resp0nses are judgmental. That is the resp0ndents are t0 think and judge their c0mpetence 0n each skill. F0r example, if a research questi0n says, “t0 what extent d0 teachers p0ssess pr0fessi0nal skills in metalw0rk,” the resp0nse scale sh0uld be little, l0w, high, very high.
8.Empl0yee Training M0del:
This is a m0del that inv0lves identificati0n 0f kn0wledge and skills that sh0uld be imparted int0 an empl0yee under j0b situati0ns. This used t0 be a s0phisticated m0del because it g0es bey0nd 0rdinary kn0wledge and skills. It inv0lves p0licies, security, facilities and management (finance) and relate it t0 the c0st and the benefits. It c0uld als0 be called the “Tell Them M0del” where learners are taught the skills they need t0 be gainfully empl0yed.
9.Needs Appr0ach/M0del (Ask Them):
This is a m0del used in carrying 0ut a research w0rk pr0bably f0r individuals and c0mpanies that have made up their minds t0 begin a pr0ject but they d0 n0t kn0w h0w t0 set ab0ut it. Their needs must f0rm the fulcrum 0f the study. This c0uld be used in carrying 0ut a research f0r retired pe0ple 0r wealthy individuals wh0 have made up their minds t0 establish a pr0ject but need assistance in carrying it 0ut.
10.Pr0gramme / Pr0ject Evaluati0n M0del:
This is a m0del f0r determining the value 0f a pr0ject. It is an assessment m0del f0r determining whether t0 st0p 0r c0ntinue with the pr0ject. It is similar t0 c0st benefit. In this m0del, we identify all c0sts and all revenue and c0mpare them. Where marginal c0st (MC) is greater than marginal revenue (MR) that is a l0ss. But where marginal c0st is equal t0 marginal revenue that is breakeven p0int. Where marginal c0st is less than marginal revenue that is a pr0fit.
An0ther way 0f using this m0del is in determining the value 0f a pr0ject 0r equipment f0r sale f0r the purp0se 0f using it as a c0llateral with a lending agency.
11.M0dular Appr0ach/M0del:
This m0del helps t0 is0late the splinters 0f s0me pr0grammes and help t0 re-c0mbine them int0 requirements f0r a specific j0b. It is als0 a c0mplex m0del that requires the inv0lvement 0f many experts. F0r example, if s0meb0dy wants t0 be a p0ultry farmer, this m0del d0es n0t believe that a farmer sh0uld be exp0sed t0 0nly skills in p0ultry management. It believes that the pers0n needs s0me m0dules 0f experience in the f0ll0wing areas:
Tillage in the area 0f S0il Science
Farm Machinery in Agriculture Engineering
Cereals pr0ducti0n in Agr0n0my.
F00d preparati0n in Nutriti0n.
Skills in particular aspects 0f p0ultry such as egg pr0ducti0n, br0iler hachuring depending 0n the needs 0f the farmer. In this case, the p0ultry farmer can rear his p0ultry and pr0duce his 0wn feeds thr0ugh the management 0f relevant m0dules.
12.Functi0ns 0f Industry M0del.
This is a m0del that c0uld be used t0 c0nduct research in tw0 directi0ns.
F0r impr0ving the 0perati0ns 0f an industry.
F0r establishing an industry thr0ugh zer0-base.
There are certain functi0ns an industry is supp0sedt0 perf0rm in 0rder t0 functi0n f0r pr0fit. Where an industry is n0t making that pr0fit, a research is c0nducted t0 identify what it sh0uld be d0ing in 0rder t0 make pr0fit. The result is, theref0re, integrated t0 impr0ve the functi0ns 0f the industry.
In a zer0-base situati0n, the skills will be identified and used f0r the take–0ff 0f a similar industry elsewhere 0r in an0ther c0untry. The m0del c0uld be used t0 identify skills f0r impr0ving a training pr0gramme that supplies manp0wer f0r such industry 0r its allies.
13.C0st-Effectiveness Analysis M0del:
This m0del is usually empl0yed in identifying and selecting a pr0ject with 0ptimum benefits when c0mpared with 0thers. The primary applicati0n is in the determinati0n 0f the w0rthiest 0f several alternative pr0grammes, c0urses, delivery systems, facilities and s0 0n.
In carrying 0ut C0st-Effectiveness analysis, the f0ll0wing c0uld be d0ne:
Identifying the c0sts 0f all alternative pr0grammes 0r pr0jects.
Determining the ass0ciated benefits.
Selecting the alternative with m0re benefits f0r given c0sts 0r the alternative with the least c0st f0r specified benefits.
14.C0st-Benefit Analysis M0del:
This is a m0del that c0uld be used in deterring the quality and efficiency (attainment 0f an 0bjective at the l0west c0st) 0f v0cati0nal technical educati0n pr0gramme and their pr0ducts in relati0n t0 the c0sts and their benefits.
It is used in making a ch0ice am0ng tw0 c0mpeting pr0gramme f0r meagre res0urces.
It makes f0r c0mparis0n am0ng many pr0grammes based 0n their benefits thereby pr0viding the basis f0r selecti0n 0f such pr0grammes. F0r example, tw0 technical educati0n pr0grammes c0uld be devel0ped as f0ll0ws:
A pr0gramme that w0uld benefit 0nly first year NCE students 0nly with specified c0st.
An0ther pr0gramme that w0uld satisfy the needs 0f the first, sec0nd and third years, NCE students with the same c0st as number 1 pr0gramme.
N0te, b0th pr0grammes pr0vide benefits t0 a gr0up 0f pe0ple and t0 be run at the same c0sts-which 0ne w0uld y0u select? The benefits here are the gains derived 0r derivable fr0m a designed pr0gramme by individuals 0r gr0ups. Benefits are 0f different f0rms s0me 0f which are:
Tangible benefits which are identifiable 0utc0mes 0f executing a pr0gramme, e.g students acquisiti0n 0f specified technical j0b skills relevant in specific j0bs.
Target benefits described as anticipated benefits 0f a pr0p0sed pr0gramme 0btained fr0m estimate 0f benefit determined by pil0t testing 0r fr0m benefits identified by 0ther sch00ls wh0 had m0unted similar pr0grammes.
Individual benefits which may c0me as a result 0f the individual deciding t0 register f0r skill impr0vement pr0grammes. It may lead t0 increase in salary after the training.
The business and industry benefits likened t0 ec0n0mic benefits t0 the business and industries where the manp0wer bec0mes efficient due t0 training and theref0re, high pr0ductivity.
S0cietal benefits - This is due t0 the fact that public funds are used in funding educati0nal pr0grammes. The c0ncern theref0re, w0uld be meeting the career devel0pment needs 0f individuals t0 prepare them f0r pr0ductive and m0re useful life in the s0ciety.
N0n-Ec0n0mic benefits - These include satisfacti0n 0n the j0b, w0rkers m0rale, devel0pment 0f t0lerance attitude, change t0ward s0cial pr0blem and s0 0n.
Intermediate benefits which are th0se derived fr0m the take–0ff 0f a pr0gramme and the realizati0n 0f ec0n0mic benefits.
F0rmative benefits derived during the pr0cess 0f learning 0r during training sessi0ns determined thr0ugh practicals, tests, assignments given t0 learners at intervals.
Summative benefits determined by analysing the achievement 0f intended 0bjectives t0 indicate the success 0f a pr0gramme.
Ultimate benefits epit0mized in the after training perf0rmance 0n designated situati0ns.
They are real life 0r 0ccupati0nally related.
Selecting pr0grammes based 0n benefits and c0st makes f0r placement 0f pri0rities in ch00sing pr0grammes. Estimating c0st and benefits, the f0ll0wing steps c0uld be ad0pted:
C0nsider the stage 0f a pr0gramme whether at the pr0gramme devel0pment stage 0r the stage 0f 0perati0n 0f the pr0gramme.
Devel0p and analyse the pr0gramme benefits.
Subject the benefits t0 review by experts t0 ensure relevance t0 intended beneficiaries.
Determine the data and rec0rds t0 be empl0yed in evaluating the c0st-benefit.
Devel0p a meth0d 0f rec0rding the data 0r inf0rmati0n 0n the 0utc0me 0f the pr0gramme.
Devel0p a meth0d 0f determining the c0st f0r the tw0 phases 0f a pr0gramme. F0r example:
Programme: Computer Servicing Technicians
Pr0gramme Devel0pment Phase Yearly Per Student/Year

1. Expenses auth0rizati0n phase
2. Pil0t learner reimbursement
3. Material c0st
4. Lay0ut design c0st
5. Draft preparati0n (typing/ typesetting) c0st
6. Pr0gramme repr0ducti0n c0st
7. Administrative c0st
8. Evaluati0n c0st
9. Meeting c0sts
10. C0st 0f travels, etc.
Operating Cost
C0st 0f material supply
Building and maintenance c0st
Administrative c0st, etc.
Additional cost
C0mputer the c0st-benefit pr0file based 0n the 0bjectives devel0ped ( see f0rmat bel0w) Intermediate BenefitsDesired Achieved
Kn0wledge achievement
Skill achievement
Attitudinal
Number admitted
Rating by empl0yer(general)
Rating by empl0yer 0n specific skills
0thers
Ec0n0mic BenefitsDesiredAchieved
Salary increases…………………………………………………
Pr0ductivity increases…………………………………………..
Rate 0f manp0wer turn0ver……………………………………..
Rate 0f unempl0yment………………………………………….
N0n-Ec0n0mic Benefits
J0b satisfacti0n ……………………………………..
Increases in j0b p0siti0n———————————————-
Determine the situati0ns f0r making decisi0n using the c0st benefit pr0file in step 7. The pr0bable situati0ns c0uld be:
determining the 0ptimum f0r students
justifying all0cati0n 0f res0urces
enc0uraging better use 0f res0urces
determining 0ptimum all0cati0n 0f duties t0 staff
determine pr0grammes that c0uld be dr0pped
determine c0st-saving measures f0r pr0grammes with high c0st demands.
C0nclusi0n
A research m0del is an appr0ach thr0ugh which research activities in educati0n can be carried 0ut t0 achieve end results. A number 0f m0dels have been identified, and which c0uld be appr0priately applied in carrying 0ut specific research activities in the different areas 0f educati0n. It sh0uld be underst00d that a research m0del is different fr0m a research design. A design can make use 0f 0ne 0r m0re m0dels.
Enabling Activities
Study s0me research rep0rts accessible t0 y0u and identify if any 0f the ab0ve menti0ned m0dels are used. Determine h0w appr0priate this m0del is when c0mpared t0 the instrument used.
Date: 1989
(ii) Edit0r: R0manus 0gb0nna 0huche
Title 0f B00k: C0ntinu0us Assessment in Africa,
Publisher: Th0mas - Nels0n Place: Lag0s
Date: 1990 Editi0n: 3rd editi0n.
Pr0vide pr0per reference t0 the f0ll0wing peri0dicals:
Auth0r: James Hassan
Article: Students’ Attitudes t0wards H0mew0rk in Mathematics.
J0urnal: Internati0nal J0urnal 0f Educati0n,
V0lume3. Number 1.
Date: 1988. Pages: 73–86.
Auth0r: Sunny Chika Nwachukwu
Article: The Rise and Fall 0f an Academic Giant Newspaper: The Guardian 0f Saturday, 6th January 1990.
Page: 6
a.Auth0r: Emmanuel Ekpendu Ihim.
Title 0f w0rk: Fact0rial Validati0n 0f an Instrument f0r Assessing Classr00m Interacti0ns.
Type 0f w0rk: D0ct0ral dissertati0n
University: Ahmadu Bell0 University, Zaria
Date: 1965
CHAPTER TWO
2.1Writing Chapter Two of the Report - Literature Review
Many students have asked some questions regarding literature review. Some of these questions include:
What is literature?
What is literature review?
Why do we review literature?
How should literature review be conducted?
Some attempts are made in this chapter to provide answers, to these questions.
2.1.1What Is Literature
Literature refers to a collection of printed materials provided in the form of book journals, magazines, newspapers, abstracts, extracts, etc.. dealing with specific subject. All the writings or contents will be addressing a particular area of knowledge: it also. Refers.to all. The writings of a.-country. at a period of rime as in the case of the French, Literature, English literature,’ the Nigerian literature. (Hornby, 1974). Also, literature refers to all pruned materials describing or advertising something.
2.1.2What Is Literature Review?
Literature review as far as research work is concerned is an exhaustive … survey or search of what has been done or known on a given problem. When a researcher identifies problem and raises topic therefrom, he is obliged to review what has been written already, regarding the problem or related areas He would want to know other studies done m the area and the extent of work done. This will enable him decide whether to continue the study or not; or whether to change his approach or not.
2.1.3We Review Literature?
These are some of the reasons for reviewing literature.
The literature review helps the researcher to discover the extent of work done already in the problem area.
To help formulate some hypotheses or straighten out the research questions.
To help build a mental picture of what the solution to the problem may likely be.
To discover whether the problem has, already been studied’ i.e., to ascertain whether the answer to the problem under study has already been provided and documented - to prevent unnecessary duplication and waste of efforts.
To discover other possible problems arising as a result of the problem to be studied.
It sharpens the general picture of the problem under focus so that the researcher obtains a more precise knowledge of the problem.
To discover, research techniques arguments, analysis, and conclusions of previous studies of similar nature.
To define and control goals in a research study.
Literature review gives insights into methods to be used in the study as well as new approaches.
It helps the researcher to admit his research problems
It also-exposes the significance of the study;-who should benefit: from the study and how to-benefit.
Exposes the gap that is existing after previous studies which the present study should aim at filling.
2.1.4The Design of Literature Review
There are various designs for writing literature review. Many Institutions: (Universities, colleges and polytechnics) adept the design that suits their convenience. The general or universal design for writing literature. Revise is itemized below.
Break-up the review in line with topic research questions and hypotheses
Introduce the steps with a sentence or two.
Review Literature sequentially as. arranged; sub-heading arising from research questions and hypotheses.
Relate each sub-section to the topic i.e., put each sub-section into perspective. In other words, let each step attempt to throw light to the topic or the problem.
Make a summary of the review at the end, expressly showing the gap your study intends to fill
2.1.5Breaking - Up Review in Line with Research Questions and Hypotheses
What is required is that if you have five research questions, it is expected that you should have at least five sub-headings in the literature review, each research question being reflected in the sub-headings review. Literature review blows light upon the research questions which, guide the study. It throws light which enables the-researcher see early the boundaries or the scope of the question. Let us give example with our former research question viz. ‘Job satisfaction among Technical teachers in Enugu State.’ For literature review, the researcher may raise sub-headings as follows:
Job satisfaction
Technical teachers
Productivity among technical teachers
Summary of literature review
For masters and doctoral theses, it is always expedient to start with theoretical framework; philosophical frame work or historical frame work depending on the one that suits the study. This means that the’ first subheading for higher degree should be the frame work. However, it should not be seen as a law to include the framework. It should be included if it is found necessary and if one’s supervisor approves of it. In any case, it points to the maturity level of the researcher.
There is no one way of introducing the chapter. A simple introducing the chapter. A simple introduction should be used. An example has been shown below:
The related literature has been reviewed under the following study heading:
Theoretical, or philosophical framework of productivity among workers.
Job satisfaction.
Technical teachers in Enugu State.
Productivity among technical teachers
Summary of literature review,
2.1.6Sequence in the Review
The researcher should arrange the subheadings so that one flows into the other. He will review the literature in sequence as it is listed, making s’ there is a summary of the review at the end.
2.1.7Putting Sub-Headings into Perspective
Each sub-heading should be linked to the topic or the problem under study often, students write sub-headings that are distinct from each, other and which have no connection with the main topic. Each sentence or should flow and point to the topic under study. Disjointed ideas or study headings do not contribute significantly towards the entire objective of the study.
2.1.8Summarizing the Literature Review
Literature is not reviewed for formality as sortie students tend to think. on cardinal objective of the review is to discover the gap that has existed after other researchers have made their contributions. This is necessary because it is expected that after the findings have been made, during the discussion the researcher should be able to show evidence that his study has what filled the gap or not. So, there is always a link between the literature review and the findings of the study. It is in the summary of the literature review that the researcher raises as it were, one part of the hook, while the second part is raised and connected in the discussion of the findings made in the study.
2.1.9Conducting Literature Review
Literature can be reviewed following some steps namely:
Step one: List key words in the topic. For example, in the topic Job satisfaction among technical teachers, the key words are;
Jot
Job satisfaction Teachers
Technical teachers'
Productivity among workers
The researcher can go to the library and read books, journals, magazines, newspapers which have articles reflecting the key-words. As he-reads, he jots down important assertions or comments considered relevant to the problem under study.
Step Two: Cheek preliminary sources. These include index, abstracts etc.. that are intended to help one identify and locate research articles and other sources of information. See also the following:
Resources in educational index
Current index to journals
Thesaurus (a book that enables one identify words of similar meanings),
Descriptions and
Psychological abstracts.
2.1.10Making Use of the Library and the Librarians
Librarians all over the world have classified knowledge into several subjects and further re-classified the subjects into several headings sub headings and sub-sub-headings. All you have to do is to tell them. librarian what problem you are investigating, give him or her some time, and the librarian will be able to give you back a list of references of works that have been published in the area of your interest. The librarians have been trained to assist readers specially to get to the information they need; Therefore, make use of the librarians, go to them and where possible pester them until 1 they satisfy you. The librarian will be glad that he helped you. That is part 1 of the etiquette of their profession.
2.1.11Sources of Information/Data
Primary Sources: These are sources which contain direct or original accounts of an event or phenomenon given by someone who actually 1 observed the event or the phenomenon. Such sources include: Students! Research project reports, report of research conducted at the national or international level, journals, abstracts, publications,conference proceedings, technical reports, periodicals etc..
Secondary Sources: Theses are materials which contain an account of an event or phenomenon by someone who did not actually witness the event or I the phenomenon. one cannot be sure or determine how much the author of I secondary source materials has altered the original or primary materials Secondary sources include textbooks, other books, reviews of research reports, encyclopaedias, book reviews etc..
Specific Literature Sources: These are:
Encyclopedias And Dictionaries
for accurate definitions
clearer comprehension of key terms and concepts.
b). Books
detailed knowledge in the area where the. Researcher intends to cover. Many, books should be read to compare knowledge, or contents since they are secondary sources.
(c) Journals And Periodicals
these contain the original research reports of other research workers
the knowledge contained in them represent the most recent in the field
- they are primary sources; they have been critiqued and assessed before publication.-
(d) Magazines And Newspapers
these show current views and opinions of people in the particular area of interest.
(e) Students’ Projects, Theses or Dissertations
useful sources of information
usually contains, the most current format or method of research report.
Note:Don’t duplicate errors. That a thesis or project report has been examined; assessed and deposited in the library does not mean that it does not contain any error/at all from the beginning to the end, so, be careful in picking materials or information.
2.1.12Preliminary Library Information Sources
These sources include:
The Catalogue
provides information leading to the location and retrieval of books in a library. There are two types of catalogues namely:
the subject catalogue and
the author catalogue
The Index
this lead? to the retrieval of articles published in journals There are
subject index and
author index
there are also Current Index to Journals in Education (CIJE) etc. and others. The Abstract This consists of a short account of a work in addition information necessary for the retrieval of the work. Necessary information such as name of author, title of work, journal volume, number, pages and date are obtained therefrom.
there are psychological abstracts; sociological abstracts etc..
2.1.13Organization of Information Collected
The following suggestions, can guide the researcher:
Arrange the review In Sub Themes
synthesize and organize information in sub-themes. The appropriate sub-themes should relate to the topic of the research
Paraphrasing
In reviewing literature, a passage or an idea can either be paraphrased or cited. For paraphrasing, the reviewer re-states the passages in his own words. This means that* an idea can be rewritten in another form other than the form it was found.
Quotation or Citation
In citation, usually passages are lifted the way they are.
In the past, if a passage is cited, it was enclosed with quotation marks. Such practice is no more in vogue as different styles of citation unfold every day. Long passages (e.g. 4o words and above) are usually indented. Indenting refers to the style of writing in which the passage is placed at the centre of the page with ample margin on both sides. If a quotation is indented, the page from where it was ' lifted.is usually included.
In reviewing literature the researcher is advised to consider the following suggestions:
It is important to note that too much volume of literature review is not necessarily the best practice. Sometimes, it makes the reader to derail off the train of thoughts the researcher is leading ‘him to; further, the volume may discourage the reader and he will feel disinterested in reading the- entire literature review. If your reader feels bored over your reviewed work, he may simply glance through and assess the work grudgingly and subjectively. The volume of literature review should be moderate and tailored towards the research questions and hypotheses. For first degree project 15 to 3o pages are ideal; for masters degree project 3o to 55 pages are good; and for doctoral (Ph.D.) thesis 6o pages and above are conducive. However, there is no hard and fast rule in the volume. Some works have large volume of reviewed literature but disjointed, rendering the volume useless and unacademic.
Do not introduce words that will compel the reader to go to dictionary first before understanding them. Experts in research are not interested in high sounding words or big words but in the systematic way of arriving at the findings and the conclusions made in the work.
Always endeavor to summarize your literature review at the end of the review; you should be able to articulate the state of the art with respect to the problem under study. In other words, you should be able to know the current work and efforts made by other people in that area of study. This is necessary since you will have to refer to the level of their efforts during discussions of your findings. You will see that as you refer to their contributions in your own discussion of findings one will be able to know whether your study made any significant contributions towards* the solution to the problem studied. The researcher will have a sense of achievement if he made some contributions to knowledge and this is how knowledge advances.
Always acknowledge the contributions of other people. Do not lift passages or ideas and claim them as your own. That practice, is referred to as plagiarism. If you. take someone’s statement from his work you should show that the idea is from the person and not from you
There is the need to be mindful of tenses, spellings and grammar. Ideas, expressed, in writing should be smooth and flow freely into the, ears of the reader. Bad grammar annoys the reader and it raises unfriendly repulsive attitude between the work and the reader.

Figure 5.1: Guide to Reviewing Literature in the Library
The steps shown in figure 5.1 can be very helpful when the researcher is reviewing related literature to his topic. The researcher will not fail to start first to consult his own books, journals, etc., that are relevant to his topic. one of the most important needs of the researcher is to understand the problem under study and how to get to the solution. Remember to run back to your supervisor or other experts whenever you are in difficulty.
Review Questions
What is literature review?
State five reasons for reviewing literature
Why should the literature be connected with Research Questions and Hypotheses?
What do you understand by putting your work into perspective?
Write Short Notes on:
Primary sources of data
Secondary sources of data
The Catalogue
The Abstract’
The Index
Choose a researchable topic and discuss. How you can carry out literature review on the topic.
Differentiate between paraphrasing and citation.
a. What is plagiarism?
b. How will the researcher avoid plagiarism?
2.1.14Organizing and Presenting Research Report
Most students type their own theses while others have them typed by secretaries who are not familiar with thesis form and university requirements. For both of these groups as well as others, the following guidelines and suggestions should be of assistance in producing a satisfactory finished typescript. It must be emphasized, however, that although this chapter is designed specially to guide the student and the typist, it does not contain all that he or she needs to know in order to produce a paper in acceptable final form. Familiarity with the references cited at the end of this chapter is necessary.
2.1.15Responsibilities of the Student and of the Typist
Much misunderstanding and frustration can be avoided by establishing a clear line of responsibilities between the student and the typist. Areas of responsibilities should be discussed in definite terms and agreed upon before the typist begins. The student should be responsible for the correct presentation of his paper in its entirety including all the preliminary, illustrative avid reference matter. The student should also be responsible for the main body of the text. The typist, on the other hand will be responsible for producing a true and exact copy of the draft submitted by the student- This responsibility encompasses wording, punctuation and spelling, although an obvious case of misspelling should be called to the student’s attention and corrected. The typist should be expected to assume responsibility for any retyping that is required because of intrusion into margins, particularly on the right-hand side. Word divisions should be kept to a reasonable minimum, but because of inevitable variation in length of lines, the typist must also be responsible for proper syllabication of words when required.at the end of lines.
A typist should be expected to give a quick proofreading to each page before removing it from the machine. Simple corrections can usually be mad at this time so that they are hardly noticeable. The discovery ‘of even typographical errors usually requires a retyping of the entire page if the sheets have been removed. The reason is that the original and carbon copies cannot be placed back on top of each other exactly enough to make correction with the use of carbon paper. Corrections made separately on each sheet are particularly noticeable on the carbon copies. After removing the pages from the machine, the typist should proofread them a second time. Errors missed the first time are frequently caught in this way.
The typist is responsible for cleaning the typewriter keys at frequent intervals so as to guarantee the best possible impression. The agreement between the student and the typist should also be explicit with respect to cost, time schedule, and any unusual requirements not ordinarily included in typing straight copy.
Paper
Most universities require the student ^ copies of his thesis typed on a good quality bond and quarto size. A rag content of twenty-five or fifty percent ordinarily required. The higher the percentage the mire durable is the paper. The so-called erasable paper should not be used unless it is specified by the institution to which the paper is to be presented.
Typewriter
Either pica type (ten spaces to the inch) or elite type (twelve spaces to the inch) is satisfactory for most typing jobs. Use of elite type results in an increase of about one fifth in the amount of typewritten material that can be put on one page. Elite type is recommended, but the student should make sure that it is acceptable to the institution in which he is doing his work.
Guide Sheets
There are different ways that the typist may keep track of the point on the page where he is typing. The typist can use a special guide sheet drawn on onion-skin or other thin paper that make the lines and numbers extra-dark. When this sheet is placed between the original copy and the first sheet of the carbon paper, the typist can read through to it and know exactly where he is working on the page.
Another method which may be used is a sheet of paper, nine inches in width with lines of type numbered in both ascending and descending order from the point at which the first line of typed material appears on the page to the point at which all typing should end. These line numbers are placed on the extreme right-hand side of the sheet. When this guide e is Placed behind the last sheet of typing paper, the one-half inch with the number extends to the right beyond the thus the typist has it in sight all the time and always knows ‘rom it where he is vertically on the page. Whether a special guide sheet is used or not, the typist must bear in mind that twenty-seven double-spaced lines are all that should be placed on any page of properly proportioned thesis work. If any deviation is allowed, not more than one single-spaced line above or below that limit is permissible.
Corrections and Erasures
The number of corrections to be made should be kept to a minimum and made as neatly as possible. Pen-and-ink corrections, whether in the form of changed letters, deleted letters or words, or added letters or words, are never permissible in a thesis. Either the error should be corrected on the typewriter or the page should be retyped.
Erasures should be reduced to a minimum and made with such skill on both the original and the copies that they will not be noticeable. Wherever possible they should be made before the page is removed from the typewriter. Typists should form the habit of looking over each page before removing it from the machine. once withdrawn, each copy of the set should be corrected separately by direct type rather than all together by restacking and insertion of carbons. Care should be taken to strike the keys heavily or lightly, as the case may require, so that the corrected portions may match in colour as neatly as possible the rest of the typed material on the page.
Ribbon
Ribbons of superior quality are most satisfactory in typing the final copy of the thesis. Medium inked black ribbon produce greater uniformity of impression than the light inked or the heavy inked. To achieve superior uniformity of type colour it is desirable to have on hand before the typing is begun enough ribbon of the same kind to complete the job. The typist should obtain a supply of ribbons so as to be able to change them after each twenty-five pages or so.
Proofreading
The student should reread the final draft copy of his thesis before delivering it to the typist. After the typist has proofread each page, both before and after removing it from the typewriter, the student is again responsible for a final, extremely careful proofreading. No matter how many times a student and a typist check a thesis for typographical errors, at least one always seems to escape detection. The aim, of course, must be to reduce undetected errors to the lowest minimum that is humanly feasible to achieve.
Verb Tense
The manuscript should be written basically in the past tense. This is because a thesis recounts what has already been accomplished. It does not, however, mean that the author may not use present tense and future tense forms. When the writer uses the present tense, he should make it clear to the reader that the explanation or discussion in which these tenses are used has to do with what will be true at some future time of reading! Frequent use of these tends to confuse the reader and to give the notion that the thesis is merely a general discussion or an essay embodying unsubstantiated opinions of the author.
Many students find it difficult to cite findings of others. A helpful suggestion is to bear in mind that the individual being cited did his work and wrote his article at some time in the past. If his findings are described in the past tense, it often gives the impression that those findings are no longer true. To avoid this false impression, a present tense verb can be used in the dependent clause within the sentence. For example, Uwaeme found (past tense) that shorthand teachers do not possess (present tense) the necessary textbooks to encourage their students to do homework assignments.
Some students get into difficulty when they confuse the Perfect with the imperfect tenses. It is wise for the student to maintain an orientation as to what will be the correct time relationship for a reader one year after the paper is completed. Furthermore, a careful use of would and could should be made in order to improve the effectiveness of expression.
Clarity
Clarity in writing is essential. Be precise and clear in presenting ideas. Eliminate jargon that most readers will not comprehend. Sometimes a researcher will develop an abbreviated notation for referring to a specific variable procedure; such abbreviations may be convenient when communicating with others who are directly involved in the research project, but they are confusing for the general reader.
The entire report should be coherent. Ideas should be presented in an orderly, logical progression to facilitate understanding. The researcher must remember that he is writing for someone who is being (introduced to new ideas and research findings for the first time. The researcher’s choice of words, sentence structure, and general organization should be directed toward facilitating communication with the reader.
The first draft of the thesis report is bound to be rough and will need to be improved. It is normally a good idea to re-read the report a few days after writing the first draft and to make corrections that are necessary. It is necessary to find one or more people who will critically read your report and make suggestions for improvement. The researcher should not ‘be angry or defensive when he receives the criticism he asked for. The researcher should be prepared, then, to write several more drafts before a satisfactory finished product can be achieved.
Acknowledging the Work of others
It is extremely important to clearly separate the researcher’s own words and ideas from those obtained from other sources
A passage drawn from an article or book should be presented as a direct quotation or paraphrase and the source acknowledged there is nothing wrong with quoting another author as the source, acknowledged. on no account should another person s idea be presented as the researchers own. This is plagiarism and is inexcusable. It is also unethical and. sometimes illegal.
References and Bibliographies
Because of the need to related the research to a body of knowledge a list of references will be a vital element of a master s doctoral thesis. Such a list will include all relevant works which have been consulted by the author and which have been cited in the text. A distinction is made between a list of references and a bibliography where the latter is supplied as a comprehensive coverage of books and journals in an area, even though these may not have been cited in the text. Most thesis will not carry a bibliography unless the researcher has publication in mind.
The references begin on a new page in the report. The references must contain complete citations for all sources mentioned in the report. No source from the list of references should be omitted; also any sources that are not mentioned in the report should not be included in the references. They, however, can be included in the bibliography. In the body of the thesis report, references are cited by giving the last name of the author, followed by the date of publication.
The following citation methods are in order:
Adams (1999) found that ….
In a recent study on looting (Adams, 1999) ….
Writing on capacity building, osuala (1998) gives ….
Each complete citation in the reference list show the name of author the title of the publication, and facts of publication. The reference lists at the end of the chapters in this book follows APA style. other faculties may require different forms. It is necessary to check the rules for references before a student; writes his or her report. Furthermore, if the student is writing in strict APA style, he should follow the current format for citing the references.
Sexist Language
one aspect of style on which students often seek guidance is the use of personal pronouns. Because student projects are usually of a personal nature there is obviously much scope for “I” to be used throughout the report. This may be avoided by the use of the passive voice; thus: ‘It was found …’ is used instead of ‘I found that traditionally, in most fields of research use of the passive voice has been favored. Students should avoid sexist language, namely the use of “he”, “his”, “hers”, “man”, “man’s”, “I”, “we”, and so on when both males and females are meant. Usually, sentences can be rephrased or specific pronouns deleted to avoid biases implied by sexist language.
Preparing for an oral Examination
It is possible that at all levels of writing, whether dissertation or thesis, the student will be called upon to meet one or more examiners in order to defend his conclusions verbally; the award of a Ph.D will certainly involve this. The wise student will accordingly prepare for it as thoroughly as he can with a view to confirming the high opinion that the examiners should already have conceived of his research from the study of his written report. The academic world is, of course, well known for its conflicts of opinions on topics and the doctoral student should do his best to ensure that there will be no antipathy towards him simply because of the line of argument he has pursued.
The student should attempt to place himself in the position of the examiner and consider the type of question which he may put in order to evaluate the report. To provide the student with a systematic basis for anticipating how his research may be evaluated, a number of questions under each of the criteria below are posed which the doctoral student should seek to satisfy. To do this, a checklist proposed by Hansen and Waterman (1966) is drawn upon in part.
Evidence of an original investigation or the testing of ideas.
Was the purpose of the researcher clearly described?
Were the hypotheses to be tested, questions to be answered, or methods to be developed clearly stated?
Was the relationship between the current and previous researcher in related topic areas defined, with similarities and differences stressed?
Are the nature and extent of the original contribution clear?
Competence in independent work or experimentation.
Was the methodology employed appropriate? Was its use justified and was the way it was applied adequately described?
Were variables that might influence the study recognised and either controlled in the research design or properly measured?
Were valid and reliable instruments used to collect the data?
Was there evidence of care and accuracy in recording and summarising the data?
Is evidence displayed of knowledge of and ability to use all relevant data sources?
Were limitations inherent in the study recognised and stated?
Were the conclusions reached justified in the light of the data and the way they were analyzed?
An understanding of appropriate techniques.
Given the facilities available, did it/seem that the best possible techniques were employed to gather and analyse data?
Was full justification given for the use of the techniques selected and were they adequately described? In particular, were they properly related to the stated purpose of the research?
Ability to make critical use of published works and source materials.
Was the literature referenced pertinent to the research?
To what extent could general reference to the literature be criticised on the grounds of insufficiency or excessiveness?
Was evidence presented of skills in searching the literature?
Was due credit given to previous workers for ideas and techniques used by the author?
Is evidence displayed of the ability to identify key items in the literature and to compare, contrast and critically review them?
Appreciation of the relationship of the special theme to wider field of knowledge.
Was the relationship between the current and previous research in related topic areas defined, with similarities and differences stressed?
Was literature in related disciplines reviewed?
Was an attempt made to present previous work within an overall conceptual framework and in a systematic way?
Worthy, in part, of publication.
Was the organisation of the report logical and was the style attractive?
Was there evidence of innovation in research methodology compared with previous practice in the field?
Distinct contribution to knowledge.
What new material was reported?
To what extent would the new material be perceived as a valuable addition to a field of knowledge?
To what extent do the conclusion overturn or challenge previous beliefs?
Were the findings compared with the findings of any similar studies?
Was the new contribution clearly delimited and prospects further work identified?
To what extent does the work open up whole new areas for future research?
The student should rehearse his answers to an appropriate selection from the above list of questions. This procedure should indicate what additional evidence will need to be taken into the examination. In the main, any supplementary material will relate to the data gathering and analytical phases, but may also include papers which the student has written during his research.
Whatever the level of the examination, it should go without saying that the student, if called upon, will be able to defend, explain, elaborate, or even apologise for any part of it. If an unacceptable weakness is found by such a student after a thesis has been submitted, criticism is best anticipated and coped with by preparing a typed statement for distribution at the start of the examination.
With regard to the oral examination itself, possibly the most important advice that can be offered is that the student should not attempt to “pull the wool over the examiners’ eyes. Very rarely will it be possible to get away with this in front of experts. It is far better that the student should admit to his shortcomings even if this means that, in part, the report will have to be rewritten.
Questions for Review
Differentiate between the responsibilities of the student and the typist in a typical agreement.
What type of paper is usually recommended for typing the final copy of a student thesis?
Write a short note on each of the following typefaces: (a) Pica type (b) Elite type
What is the minimum number of corrections and erasures a typist would be allowed to make on each completed page of a research paper?
What is the importance of proofreading?
Discuss the importance of using the past tense in the writing of a thesis. Under what circumstances, if any, should the student use the present tense in writing his thesis?
Briefly explain the rules concerning the following: pagination, footnotes, spacing, margins, books, journals, newspaper articles, unpublished works, and bibliography.
References
Brown, J.D (2oo1) Using survey in language progress. London; Cambridge University Press
Hayes, B. E. (2oo8) Measuring Customer satisfaction and loyalty: survey Design, use, and statistical analysis method. Milwaukee: ASQ press publications.
Pilot, F and Hungler, p(1995). Nursing Research Principle and methods. Pennsylvania; J. B. Lippin cott.
CHAPTER THREE
3.1Types of Research Designs
Introduction
We had already indicated that there are some conditionalities that must be met for one to correctly, as it were, apply parametric or? non-parametric statistical tool in the treatment of his data. For instance, the design used in a study will guide the type of statistics to be used. We shall now discuss the different types of designs in this chapter and the appropriate design to use vis-a-vis the appropriate statistical tools to be used in the treatment of data obtained in the particular research design that was used.
Research design can be defined as the proposed or adopted systematic. and scientific plan, blueprint, road map of an investigation, detailing the structure and strategy that will guide the activities of the investigation, conceived and executed in such a way as to obtain relevant and appropriate data for answering pertinent research questions and testing hypotheses. The five major j components or issues which the research design deals with include identifying research subjects, indication of whether there will be the grouping of subjects; what the research purposes and conditions will be, the method of data analysis; and interpretation techniques for answering research questions and or testing hypotheses. So, these are some of the basic purposes of research design, which the researcher should take cognizance of or think through in determining the appropriate design to use. one of the basic considerations’ that will inform the choice of a particular design one should use is the purpose of the study. For example, if a study is intended for establishing causation or cause-effect relationship between an independent and dependent variable, the appropriate design is experimental. If a study is designed to find and describe, explain or report events in their natural settings, as they are, based on sample, data it is a survey. on the other hand, if a study intended to identify the level to which one ‘variable predicts ascend Related viewable such a design is, correlational. Sadie that seek to provide data for mating value judgments about some events, objects, methods, materials, etc. are evaluation design studies. Broadly speaking, all educational and social science research studies can be classified into the following two descripted designs which the researcher normally would adopt in conducting this study: descriptive and experimental design. Within descriptive design are surveys, case studies, etc.. Within experimental design are true and quasi experimental designs which can be broken down further, as we shall see later, when we discuss experimental design studies.
So far, we noted that the design of the study is a blue print or plan of work for a research study and generally it involves the researcher carefully, and systematically putting into consideration some thoughts on each of the five basic and common components of the typical research design indicated above, in this section. As we noted earlier, to make a choice of a particular, design, the researcher must consider what his study is all about with regard, to what he wants to accomplish as part of his study, how many subjects would. be involved, bold they be grouped and what would each group or sample do; what would be the specific and general activities that would constitute the research conditions, and would he be able to ensure subjects’ compliance to these conditions, etc.. what would be the data of the study and what tools can be most appropriately and effectively used in analyzing such data as well as the kind of accurate interpretation that can be made from the data analyzed. After such consideration, he must then reach a decision on earl of them in. terms of whether what is called for in the design to be used is feasible, logical and sensible. This latter issue unfolds when the research is in progress; if things do not go as well as was planned in the design, each of these components can be revisit in based on the reality on the ground. Modification modified due consultation and agreement with your alter made after researcher is fully satisfied and convinced tint rancour after the interest of the aims and objectives Chapter 3 of your thesis titled Research Methodology or Methods’1 under the section design, ensure that you indicate the design of your study by name, describe it and justify its appropriateness for use in the study, include information on how it was used in the study and •so on. You may even need to cite studies similar to yours where the design you selected was successfully used and reported, assuming you used a design that is complex and not familiar to many others.
Types of Research Design
With regard to the normal research process, one can identify two broad types of research designs, experimental (parametric) and descriptive (non-parametric) designs. All studies in education and social science are either descriptive or experimental or in a number of rare cases a combination of both; an aspect of a study can involve mere description of observed events while the latter part of the same study involves testing^ hypothesis under treatment and control research conditions. But in its strictest sense, as noted earlier, all research studies can be classified as falling into descriptive design o. experimental design. Within each of these two broad categories, are sub-categories of research designs, identified under either of the two broad categories, already mentioned.
Descriptive design studies are mainly concerned with describe events as they are, without any manipulation of which caused the even or what is begin observed any study which seeks merely to fled out what is and described it is descriptive case study surely historical research Gallup poll, instrumentation study causal-cooperative studies market research, correlation research evaluation research as well as tracer studies can be categorized as descriptive. For instance, a study in which a researcher develops and validates a test instrument as its major focus based on a certain curriculum, is instrumentation or developmental design. A study in which the researcher is interested in finding out the attitude of school administrators or teachers or union leaders toward free secondary school education, is a survey. For each of the two examples cited above and other descriptive studies like them, researchers are mainly concerned with investigating, documenting, and describing events. When a new procedure, method, tool, etc.. is developed and tried out as a major focus of a study, it is a descriptive study, referred to as instrumentation or developmental design study. Note that the new procedure, method, test, is used to obtain certain relevant information existing or absent (for example, achievements) without the developed procedure, method or test itself causing any observed changes in students’ level of achievements. Similarly, an instrument developed and administered to school administrators on their attitudes toward a proposed free tuition fee for secondary education is a survey because it does not cause or influence their attitude’; the instrument is used merely to elicit information on this subject matter, which is then described. Thus, the thrust of the study here is not on instrument development (not an instrumentation design study) but on using a developed instrument for surveying a particular phenomenon, event, etc. which is then explained, described, documented, etc.. From the foregoing it ought to be apparent to you that most descriptive studies rely on observation technique for gathering information, which is then summarized (analyzed and described. Another type of descriptive design which is gaining research prominence is the case study. In this design, emphasis is given to a limited spread of scope of coverage^ rather than a wider spread; depth is emphasized. A study in which the incidence of sexual harassment at the University of Jiblik is undertaken is a case study. What are the major strengths and weaknesses of a case study? A study which investigates the history and development of a named phenomenon, over a period of is historical (for example, The Child Soldier activities in the Post-Colonial Bush Wars in Sudan). If a historical study is long-drawn out, say for about. 6–12 years, it now becomes a longitudinal study. Market research design is a study on how market forces influence cost of goods and services, productivity, buying preferences, mobility of capital, acquisitions and mergers, etc.. Evaluation studies document the status of events and passes value judgments on those events. Casual comparative studies describe how an event that is not manipulated has probable impact on another event, e.g., a study on the impact which students’ head size has on achievement in mathematics. The major weakness of casual-comparative studies, also called Ex Post Facto studies is that they may lead to wrong conclusions commonly referred to as Post Hoc Fallacy. If in the present example it was: found that students with large heads achieved better in mathematics, what does this really mean? Rubbish. Why?
While descriptive studies have been known to be very useful as a basis for collecting and documenting information for institutional policy formulation or systems-wide improvement and management decision support system, they have been recently criticized for a number of reasons. Most of the reasons are not inherently traceable to descriptive studies themselves as much as to the researchers. For instance, most researchers are not thoughtful and systematic in sloping and using reliable and valid data- gathering instruments for collecting observational or survey data. Even when this condition Is satisfied, there is also the problem of the inherent distortion of information based on data collected as a result of researchers’ over-reliance on questionnaire, interview and case study data which sign with, are most likely to be unstable than stable. for instance, describing the smoking habits of teenage Nigerians, using volunteer samples, at street corners, entertainment clubs, churches, mosques, etc. based on their response to questionnaire data should be taken with a grain of salt rather than being seen as sacrosanct; attitudes to events change and earlier attitudes described become distortions to what they are now. This explains why questionnaire data should not be considered overly rigorous or reliable. We shall discuss in more details the specific and the different kinds of descriptive designs later in this chapter.
Parametric or experimental research designs are those studies which are mainly concerned with -identifying cause-effect relationships between independent and dependent variables of a study. This type of design enables the researcher to test hypotheses upon which valid, reliable, duplicable and verifiable conclusions are premised. An experiment is a planned and systematic manipulation of certain events, procedures or objects, based on the scientific model, such that every event, procedure or object is given a fair and equal chance to prove itself. Such a proof is determined through the careful documentation of observed changes or outcomes, if any. Thus, in an experiment, every element is kept constant, except one whose effects’ the researcher is interested in. Thus, through experimental design, a rigorous and scientific approach to investigating a problem, is made possible. This design calls for establishing research conditions under which an experiment can take place before such a design is said to be experimental. For instance, the design may demand that subjects for the study are randomly drawn and grouped and or the research conditions of treatment and control be randomly assigned to subjects. Experimental design also requires that whatever variables are to be manipulated, such variables are quantifiably and clearly defined and distinct as well as rigorously complied with to avoid contamination: Also, whatever extraneous variables that can mitigate between the independent and dependent variables are identified early enough and such extraneous variables removed or severely minimized. How and what observations (testing, data collection, etc.) are to be made, when, why and by who, are indicated. The type of statistical analysis to be used in testing the hypotheses and reaching conclusions must be relevant and appropriate to the design, type of data and so on. These and other demands which we will discuss later, clearly make experimental studies rigorous.
A central need for experiment in education and social science is ensuring that proper experimental controls have been established and complied with. There are usually three levels of controls in any experiment. The first level of control in an experiment is that of ensuring that all the subjects, prior to the. commencement of an experimental study is homogeneous or equal or the same on the characteristics, which will ultimately become the dependent variable. If the subjects are different on the dependent variable, say achievement in mathematics, clearly, they are not homogeneous or equivalent, even before the experiment starts. Consequently, any difference in the posttest (post treatment test or test given at the end of an experiment) across groups of subjects, which were not homogeneous, abilities may be due to chance rather than as a result of the treatment versus control research conditions. To avoid this problem, subjects, or samples should be randomly drawn from a common population rather than their being selected. When subjects are selected, this leads to the composition of arbitrary and non-probability samples. Selection bias is a major threat to an experiment. Indeed, if research samples are selected, one can no longer consider the design for such a study as true experiment, rather the design now becomes a quasi-experiment. one other way of ensuring a homogeneous sample is through the pre-testing of jests to” obtain base-line data prior to the commencement to the pediment. Based on the base-line data, subjects are equally strutted to treatment or control condition. However, when sampled research subjects are pre-tested, the design is no longer a true experiment but a quasi-experiment design. Quasi- experimental design is less robust and is used when subjects are pre-tested and the randomization of subjects in a study is not feasible. It is a school-friendly type of design in that it can be used in schools without any disruption to the school’s class structure or timetable of academic events. This can be achieved by assigning treatment or control research conditions to selected intact classes, etc..
The second level of control in an experimental design study is the identification of the attributes of the independent and dependent variables and as well as subjects’ compliance with the manipulation and systematic observation of any changes arising from treatment condition. Note that in experiments the control condition is not manipulated but merely observed. From doing these observations, the data obtained are appropriately parametrically treated and used for testing formulated hypotheses,
The third level of experimental control involves the assurance that extraneous variables such as those enhancing or mitigating events or threats to the study are removed or minimized. There, are generally two broad categories of such threats - internal and external validity threats. These threats will be discussed extensively on their own merit later in this chapter. Meanwhile, despite these threats, you need to consider and -decide the specific type of experimental research design you will select and use for your experimental study? You will mostly probably know this for a fact after you have read the remaining part of this section. Because there are many forms of experimental designs, we will need to discuss some of the more important ones in terms of what each one of them involves. However, an extensive and complete discussion of all the currently existing 36 different forms of experimental design studies is not contemplated in this book; such a discussion is beyond the scope of this book. The avid reader, on this aspect, may wish to consult
Cochran and Cox (1983) and or Campbell and Stanley Indeed, Campbell aid Stanley described sixteen specific forms experimental design. We will discuss only four of the most common ones in discussing these forms of experimental design the following symbol will be used
K: represents the random sampling of subjects or the assignment of treatment research condition randomly to an experimental group and control to another group. Remember that when you select your samples, the design of the study is no longer a true experiment. This is why all true experimental samples should be randomly composed.
X: represents the treatment or experimental variable (independent variable) manipulated as part of the research condition for purposes of observing its effect on the dependent variable, if any. Treatment must be carefully and quantifiably described, since its impact, effect, etc. is the major thrust of the experiment. A general broad description of treatment is unacceptable. It must be presented in such a way that another person somewhere else and in another era can duplicate your defined treatment in an identical, proposed experimental research. At the end of an experiment, the analysed treatment data should be reported in line with the research questions and hypotheses both holistically and singly, on the issues raised in the study.
C: represents the control variable, or no treatment condition (placebo). Here, nothing is manipulated. This aspect of independent variable is left naturally to operate without manipulation so as to observe its effect or lack of effect on t dependent variable. Note that the control is the contrast to it treatment. No aspect of the control should be in the represents observation or test administered to subjects and which is a measure of subjects’ performance on the tentative variable. Any tools used for observation must be in me problem of the study, purpose of study, research questions and - hypotheses. Such observational tools must also be valid, reliable and useable. o and o mean pretest and posttest.
S: represents a line between levels and used to indicate equated groups or equivalent groups.
S: Represents the subject in an experimental study; the plural is Ss. E: Refers to ‘the experimental group subjects (i.e.,, the treatment subjects or those who receive X).
3.2True Experiment
In designs of true experiment, the equivalence “of the treatment (experimental) and control group subjects is attained by the random sampling and assignment of subjects to treatment and control conditions respectively. Where this is difficult to do, as in normal school settings where this is usually the case, two equivalent groups, say pupils of two streams of junior secondary three (by their being students in the same class, they may be technically considered to be academically equivalent or homogeneous) may be respectively randomly assigned to treatment or control conditions without the students themselves teeing randomly assigned to groups. The true experimental design calls for no pre-testing of subjects. We will now discuss two forms of true experimental design.
The post-test only equivalent groups design is very powerful and effective design in the sense that it minimizes, if not completely removes, internal and external validity threats to an experiment. Experimental and control groups are equated, on any of the ' research-related, pre-determined variables, through random sampling and grouping. Note that when samples are randomly drawn and grouped, they have a very high probability of being Homogeneous and representative of the populations they were drawn from.
Selection of samples in experiments introduces selection biases, and this is a very serious threat to the experiment, and findings of any study. In the above design, there is no pretest and the randomization process is part of the control to ensure that the selection bias, pretesting effects and contamination by all possible extraneous variables are removed which then assures that any initial differences between both groups, before the commencement of the research treatment conditions is very small and of no serious consequence to the observed outcome, at the end of the experiment. In this design, after subjects are assigned to groups (there can be as many groups as the researcher wants or as is required by the study but they must be made equivalent through randomization), the researcher has to decide which group will recipe treatment and which group will receive control. only the subjects in the treatment group will be exposed to the experimental treatment. The control group receives no treatment (or attributes of treatment) but in all other respects it is treated like the experimental treatment group. For instance, if the planned experimental treatment is teaching with laboratory method while the control is teaching with lecture, these conditions will Very clearly be defined in terms of their characteristics and how teachers will comply with them but more importantly these characteristics must prevail respectively to the two unique groups. The researcher must see to it that there is no mixing of any of the aspects of treatment condition with any of the aspects of the control condition. When this mixing occurs, this results in research condition referred to as subjects’ contamination. This is a very serious methodological shortcoming in research in education and social science or indeed • any research study. This notwithstanding, all other conditions of the experiment will be the same for both groups. The amount of time allotted for actual teaching, the teachers’ qualification and teacher personality, the topics taught, etc. will have to be the same for the experimental treatment group as well as the control group. At the end of the experiment, both groups arc given the same posttest which is a measure of their reaction or response to the dependent variable (achievement on a test, etc.). The mean post-test score of the experimental treatment group subjects is statistically compared with the mean post-test score of the control group subjects using an appropriate parametric statistics or tool. The underlying assumption is that if the means of the experimental treatment group is the same or very close with that of the control, then treatment is of no significance. Put differently, if the mean score of the experimental treatment group and the control group are statistically significantly different (and this difference is too large to be due to chance or to be explained to have arisen from chance factors) one can then assert that the experimental treatment conditions were responsible for the observed result; treatment caused the outcome of the observed differences between the experimental treatment and control group subjects. This design is strongly recommended for use in experimental research in education and social sciences because of its many in-built advantages one of which is the establishment of two homogeneous or equivalent research groups, as has already been highlighted. Also, this design ensures adequate controls for the main treatment effects to operate, thus effects of history is minimized or removed since there was no pre-testing, and little or no maturation since this is not a long drawn out design. For instance, because there is no pretest, there is no interaction effect between pre-test and west-test and no interaction between independent variable (teaching methods). This design is useful because of its rigorousness and flexibility in using it for studies where pre-testing is undesirable and will introduce internal validity threat. The design is used in studies where pre-testing is unnecessary, such as in studies involving early or entry level new intakes to a programme who may have no previous known level of knowledge or any knowledge at all to be pretested for. Note that this design can be extended to include more than two groups if necessary or needed. A major disadvantage of this design is that, while it establishes the differences in performances, achievements etc., at the end of the experiment, it does not allow the researcher the opportunity to observe any change when the study started but only when it ended; the reason for this being that there was no pretest which would have allowed for pre-experimental observation on the kinds of changes in the subjects that pre-existed and so on if any* within the same group of subjects or across different group of subjects. Some researchers have also observed that without pretest’s baseline data, it would be difficult to correctly assume that all the subjects in the study were homogeneous prior to the commencement of the study. They further correctly argue that randomization as we said earlier, can sometimes even if rarely, yield non-homogenous samples.
The second form of a true experiment which we will discuss is the Solomon Four Group Experimental Design. This design was established by Solomon (1964) in response to the need for finding an all-embracing and rigorous design which satisfied many of the demands by researchers seeking ways and means of removing maternal and external validity threats to their studies. The design is represented below 268 Conducting Research in Education and the Social Sciences
Solomon Four Group Experimental Design

The major and essential features of Solomon Four-Group Experimental design is that it employs an alternate to one aspect of each line of activities in the design or plan. For instance, Group 4 arrangement with regard to pre-testing is an alternate to Group 2; Group 3 arrangement is alternate to Group 2 as far as the research conditions of treatment and control are concerned. other features of this design is that it overcomes the interaction effect of pre-testing usually present in pre-test post-test design studies. Notice that subject in the experimental Group 3 are not pre-tested but they received treatment while subjects in Group 2 are pre-tested but did not receive treatment. The mean score difference between the pretest and post-test (the dependent variables) are used to determine the interaction between pre-testing and post-testing or the so-called transfer effect of pre-testing in the study. Also, notice that because pretest was administered in this design (to Groups l and 2) data from pretest can be compared with data from post-test, as Gain Scores, thus enabling the researcher to observe and determine the direction of change in the subjects. You may recall as we pointed out in the two previous paragraphs, post-test-only, equivalent ' group experimental design jacks this advantage since it does not include pre-testing. In Solomon Four-Group Experimental Design, the post-test means are used for analysis of variance calculation to determine how significantly different the subjects’ mean post-test scores are: a statistically significantly higher mean post-test score for treatment than control indicates that there is no basis for asserting that the inter-group difference was due to chance. The basis of your argument may well be that reactive effect of pre-testing did not in any way distort or mitigate the post-test data. So, by considering the’ post-test data from control group 3 that did not receive any pre-testing, any contrary argument then does not have a locus stand especially if the mean post-test value of control group –3~ is significantly higher than that of the control group 2. We can correctly assert that the experimental treatment caused the observed outcome (post-test) rather than the transfer effect of pre-testing and interaction between pretest and treatment being the cause of significantly higher achievement. Thus, control group 3 that has no pretest is acting as a balance or alternate to experimental treatment group 1 that had treatment and pre-test. By adding the control group 4, the design gains control over any possible contemporaneous effects that may occur between pretest and post-test. Seen at full glance, this design really involves conducting one experiment twice’,’ once with pre-testing to two groups and once without pre-testing to two other contrasted groups. The two pre-tested groups are contrasted between themselves as far as treatment and control conditions are concerned and the two post-tested groups are contrasted between themselves, as far as treatment is concerned. Then on their own, experimental I group 1; fully contrasts with- experimental group 3 while control group 4 fully contrasts with control group 2. The advantages of this design, in addition to that noted above, have been pointed out by Ali (1986, 1988, and 1989); this design minimizes internal and external validity threats to experimental research, to the barest minimum. But, by and large, the researcher must clearly and quantifiably define what his independent variable(s) are (experimental treatment and control) and how they will be manipulated and complied with during the study. For example, two levels of an independent variable may be guided discovery and use of a particular textbook A (treatment) and lecture/textbook B (control). The dependent variables may be students’ achievements, cognitive styles, and cognitive development in physics; a 2 x 3 factorial or Solomon Four Group Experimental Design Study.
There are two main disadvantages arising from using Solomon Four Group Experimental Design for an experimental study. The first disadvantage is that it is much more difficult to carry out the demands of this design in schools or in many practical situations. Clearly, Solomon Four-Group Experimental Design imposes more costs in terms of time, money, efforts and services than any other design because it is actually two experiments in one design. The second problem is with regard to the enormity of statistical analysis required by this design. There are four groups of subjects but six sets of data collected; given that for the four groups, there are only four sets of complete post-test data and for two groups there are two respective pre-test data. If all the groups had pretest, then there would have been eight sets of data for the groups but as you well know, this is not the case. Consequently, the complete set of data, the post-test is analyzed with analysis of variance statistics while the pretest to post-test data for two groups is analyzed with analysis of covariance for pre-test interaction effect on the post test. Doing these two tests separately is time consuming. So, statisticians have devised one test that can do both analyses simultaneously. The test that combines these two features - analysis of post-test data, and analysis of pre-test data (i.e.,, analysis of pretest-posttest covariates) is called the Analysis of Covariance, ANCoVA, when only one dependent and one independent variable arc involved. The application of this test, ANCoVA, and other parametric tests are long, demanding and rigorous, but some examples have been done for you in chapter 8.’ Because of the severe demands imposed on the researcher who wants to use the Solomon Four-Group Experimental Design, demands which an entry-level researcher may not be able to handle, it is advisable for him not to contemplate using this research design until he is adept and advanced in the techniques of experimental research; something that occurs much later in one’s experimental research experience.
When the variables investigated are numerous, such as in the 2(independent variables) x 3 (dependent variables) factorial or Solomon Four Group Experimental Design, an even more complex analysis called Multiple Analysis of Covariance (MANCoVA) is used for data treatment.
Single Group and Factorial Design: Quasi-Experimental Design
In a large number of real-life research situations, researchers find it difficult, if not impossible, to use true experimental design in carrying out studies. This may be because the scheduling and implementation of experimental treatment conditions or the randomization and grouping of subjects are not possible; in some cases, schools would not allow their programmes to be disrupted or for all their pupils to be used as research subjects. Under these circumstances, the researcher may have to fall back on only using designs which are not truly experimental and, which offer less well and less rigorous controls compared to the true experimental resign. Designs of experiments which offer such less well rigorous senses controls are quasi-experimental. To use these designs effectively well, the researcher should know their main points of strengths and fully take advantage of these while avoiding their weaknesses and pitfalls as much as he can. In other words, this involves knowing which variables have to be adequately controlled for, reducing the sources of internal and external validity threats and so on.
one type of quasi-experimental design is the Non-randomized. Control-Group, Pretest-Post-test-design. The design uses non-randomized groups and this option occurs when the researcher cannot randomly sample and assign his subjects to groups. Thus, he has to use groups already in existence such as groups already organized as intact classes, trade unions, town unions, as distinct co-operative society, women of common interest and of equal socio-economic status, (widows, etc.) members of the same social club, etc. Since the research subjects are not randomly sampled, ‘selection of subjects increases the researcher’s selection biases as, well as sampling error in terms of whether the selected subjects truly represent the population from which they were drawn and whether the subjects, when grouped, are homogeneous or equivalent. To minimize these problems, there is need for selecting subjects on such criteria which would ensure that homogeneity or equivalence of subjects in the different research groups proposed is achieved or seen to have been achieved, at the Beginning of the proposed study. Furthermore, a pretest should be administered at the beginning of the. proposed study and the pretest data can be used for finding out whether the subjects in the different groups are homogeneous (equivalent) or not. If subjects in one group score disparagingly higher than subjects in another group, in the pretest, through sorting and matching or rearrangement, it is possible to establish homogeneity (equivalence) of groups. For instance, this can be more \ - easily done by the researcher mixing high ability with low ability students equally well in all the groups so as to achieve some measure 6f equivalence or homogeneity of groups, before starting the actual research work. At the end of the study, using an analysis of covariance technique, the researcher is also able to compensate for the initial lack of equivalence between groups. Analysis’ of Covariance is a statistical technique which establishes equality of baseline pretest data, before the commencement of the study, and then establishes the covariates between the pretest and posttest, and ultimately determines whether there is any significant difference between groups based on the gain scores, i.e., difference between pretest, and post-test. Let’s look at a diagrammatic representation of the non-randomised control-group pretest-posttest design.
SamplingGroupingPretestingResearch
conditionsPost
testing
- (None)Expt. Gr 1oX i.e., Treatment o
- (None)Control Gr 2o- i.e., Control o
Given that it was not possible to randomly compose and group subjects, you may wish to consider, in the alternative, respectively assigning experiment and control conditions randomly any of the two groups. This can be done by flipping a coin, so as to decide which group is to be the experimental treatment and which group is to be the control group. As much as possible, subjects should not be informed ahead of time about what the research conditions are. Again, they should not be requested to volunteer for any particular group especially if they are aware of what each group will be involved in doing, during the research. When this happens, and subjects are aware of the research condition they will be exposed to, there is a tendency for them to react to this newness effect or awareness and consequently knowingly or unknowingly distort the -full effects which the treatment/control conditions (i.e the research conditions) is intended to have on the dependent variable (the outcome of the experiment). Even when we achieve this anonymity in disclosing research conditions to the subjects, there is yet another problem posed to this kind of design, i.e.,, in an experimental design in which subjects are selected, rather than sampled, and there is pre-testing and post-testing. This is the problem of regression.
Variable to determine their effects on the dependent variable Hypotheses are stated within the framework of a defined and acceptable related and relevant research problem. An appropriate experimental design is used for collecting data scientifically toward testing the stated hypothesis. Data obtained from an experiment are analysed and results used to accept or reject the hypothesis. Conclusions drawn on such sustained acceptances or rejections are then generalized to the entire population similar to the one the sample was drawn from so that the ultimate goals of an experiment are to predict events; control and expect certain events, build up on the body of knowledge and facts within a given area experimented upon, and discover new grounds to explore and exploit toward improving our lives on earth. Because the goals of experiments influence our lives very profoundly, a great deal of careful and important considerations constitute the framework or characteristics upon which the conduct, substance or bedrock of experiments are anchored. There are three essential characteristics of any experiment. These are control, manipulation, and observation characteristics; the so-called center piece of experiments. Read these carefully and understand them. They are important.
Control characteristic aspect of an experiment is concerned with arranging quantifiable and manipulate able research condition and such a way that their effects can be measurably investigated without control, it become impossible to determine the effect of an independent variable on the dependent variable; the control in an experiment are 1) given that two more situation are equal in every respect, except for a factor that is manipulated or added to or deleted from one of the two or more situation any deference appearing (as measured through testing) between the two or more situation is attributable to the factor that was manipulated or added or deleted from. This assumption is called the law of the Single Variable, developed by Mill (1873:2o). Indeed, Mill noted, a long time ago, that:
if an instance in which the phenomenon under investigation occurs, and an instance in which it does not occur have every circumstance in common save one, that one occurring only in the former, the circumstance in which alone the instances differ is, the effect, or the cause, or an indispensable part of the cause of the phenomenon.
The second assumption is that if two or more situations arc not equal but it can be demonstrated that none of the variables is significant in producing the phenomenon under investigation, or if significant variables arc made equal, any ‘difference occurring between the two situations, after the introduction of a new variable to one of the systems, can be attributed to the new variable.
This second assumption is referred to as Law of the only Significant Variable. of the two assumptions above, the second one is important in education and social science because it ‘is very unlikely that an outcome of a study (the dependent variable) or what we observe after manipulating the independent variable can be as a result of only one variable (acting alone without any other variable affecting or influencing the outcome, we observed). Usually, variables act in combination rarely singly, to produce an observed outcome. For instance, why is a political party more successful than others? What variables operated to ensure that a particular student scored highest in a particular mathematics achievement test administered to his class? Education and many social events deal with human beings who are constantly affected by many variables and what we observe about them, therefore, are consequences of many variables, not one Variable. Experiments in laboratories involving chemicals, temperature changes, etc. can be attributed to the law of the single variable but not in education and social science. Fortunately, in education, we can substantially minimize the effects of other variables so as to manipulate one variable, under rigorously controlled conditions, and then go on to determine its effects on the dependent variable. Within the assumption of the law of the only significant variable, other variables are operating along with the manipulated one but it is the case that these variables are controlled out or operate to a minimum, thus leaving the significant variable to dominate and exert its effects on the dependent variable. If a variable is known or suspected to be irrelevant and unlikely to operate in conjunction with a likely significant variable, such an irrelevant variable is ignored. Insignificant variables in academic achievement-related and social science studies include height; hair colour; weight; religion; tribe; shoe size; size of head, toe, hands etc.; dress preferences; musical preferences and so on. These should be uncontrolled for or simply ignored in experiments, in which, for instance, teachers’ personality and effectiveness of teaching methods, comparisons of two or more curricula or social programmes effectiveness are intended to be investigated. on the other hand, significant variables, which can influence experiments and need to be controlled for when one is carrying out experiments on subjects’ social traits, include their interests, study habits, socio-economic attainment, motivation, political affiliations, and reading ability. General intelligence, socio-economic status of parents, and others like these variables are significant variables. To reduce the effects of these kinds of undesired but significant variables, which may not be the main thrust of a study but which can affect the outcome of a study, the researcher must establish controls over them, so that their effects are minimized. The effects of these undesired but significant variables can be removed by ensuring that subjects in the research groups are equally matched on each of these undesired but significant variables before commencing with the experiments on the groups. otherwise, if for instance, subjects in group 1 are better readers than group 2 subjects, group 1 subjects have more interest than group 2 subjects, group 1 subjects have better motivation than group 2 subjects, any difference in achievements, between the two comparative groups, can be attributable not just only to the one independent variable of the experiment manipulated (such as teaching method, teacher personality/effectiveness etc.) but also to the other undesired but significant variables of reading ability, levels of interests and levels of motivation, respectively. As far as the three distinct examples are concerned, control therefore, indicates the researcher’s actions designed eliminate the influence of undesired but significant variables as well as elimination of the differential effects of undesired but significant variables upon the different groups of subjects participating in an experimental study in education and in the social science disciplines. When such controls have been achieved, the confounding, enhancing or mitigating effects of the undesired but significant variables are reduced or removed such that only one variable, the significant independent variable, is then deemed to have caused the observed outcome (dependent variable) of the experiment. There are five ways of controlling for the undesired but significant (pre-existing intervening) variables, which can enhance, confound, mitigate or mix up an observed outcome or effect of an experimental study; they are considered pre-existing because, in a sense, they existed in the subjects or the subjects had them prior to the commencement of the experiment. The five ways are through randomization of subjects, random assignment of subjects to respective groups using a sample-and-assign method to group subjects rather than sample and her then assign subjects to their respective groups; random assignment of treatment or control research conditions to research 8foups, respectively; use of covariance statistics if random sampling of the research groups cannot be achieved; use of covariance statistics if the research design involved pre-testing or if subjects were selected and then grouped for the experimental purposes; matching students and ensuring that they are all equally matched on each of the undesired but significant variables and then assigning them to their respective research groups.
Manipulation characteristic aspect of an experiment is concerned with the researcher’s actual and deliberate total and systematic compliance with all facets of the predetermined or planned events, conditions, procedures and actions which are imposed on the treatment group subjects as the experimental treatment; only treatment is manipulated while the control research condition or placebo is not manipulated. It is expected that in an experiment, the researcher must totally, rather than haphazardly comply with all aspects of the research conditions of experimental treatment (which is manipulated) as well as that of the control (events, conditions, etc. which are not manipulated). Technically, the experimental treatment condition is the hallmark or substance of the independent variable and it is the major thrust or condition that is manipulated for investigation of its effects on the dependent variable. Even when in an experimental research two or three conditions, event or actions constitute the independent variable (for example, for, a study on the Effects of discovery versus lectures on students Recall Abilities in Algebraic Tasks) discovery and lectures are the two research conditions that constitute the independent variable. The researcher may decide that discovery teaching method is the treatment condition. So, it is introduced and manipulated. Both are actively monitored and followed through for their effects on the dependent variable; in this example, discovery method of teaching is the experimental treatment condition, event or action and it is manipulated in line with the researcher complying with the five known characteristics of discovery teaching method, so as to determine its effects on student’s ability to recall algebra they were taught. The control research condition of the experiment, lecture teaching method, is not manipulated. Nonetheless, if an experiment involved two treatment conditions simultaneously (for example; the effects of warm and cold water with high quality and low-quality detergent on washing dirty clothes), both warm and cold-water conditions are simultaneously manipulated respectively using low- and high-quality detergent in washing dirty clothes to find out which one cleans the clothes better. Warm and cold water at one level, and the use of high quality as against the use of poor-quality detergent in both types of water (warm and cold) are independent variables. How well the clothes washed under these water and soap conditions are clean, is the dependent variable. The research data of their separate dual effects on the cleanliness of washed clothes can be determined by multivariate analysis, quantitatively using Multiple Analysis of Variance (assuming that waters of varied temperatures are assigned quantitative values and used to wash similar levels of dirty clothes whose cleanliness levels are determined, and after the washing, the cleanliness of clothes are assigned quantitative values, these quantities are then statistically compared).
Finally, proper and accurate observation characteristic aspect of an experimental design study partly concerns the researcher’s carefulness in determining exactly those attributes or outcomes in a study which have to be measured and recorded. Ideally, such attributes or outcomes to be measured should be quantitative dependent variables. observation, in its most direct operation in the school setting, involves testing and accurately recording students’ achievements. These require that the researcher develops and uses tests that are fair to the taste and valid and reliable for measuring | subject-matter or constructs the tests were supposed to measure. t also requires that we grade and score achievements in fair an accurate manner, using a valid and reliable marking scheme only when we do these that achievement as an index of observation of learning in schools can lend itself to a high level of predictability of learning as well as explanations of how learning occurs. When this is done, quantitative data of experiments will enable us have a better understanding of these independent variables that cause learning to occur, how successful social and economic programmes are and so on. obviously/ we cannot, as you probably know, measure learning per se but we can attach a fixed quantity at a time, place and on a given school subject (achievement) and refer to this quantity as learning. Therefore, the more Careful, thorough and rigorous are the methods of our quantitative measures of achievements in an experiment, the more accurate we would be in measuring learning, predicting learning and understanding how students learn within school” settings. This is also true of socio-economic programmes’ investigations. The sketch below illustrates the framework of the three characteristics of an experiment, i.e.,, three major demands of experiments which we discussed above: Control, manipulation and observation.
Characteristics of an Experiment
Experimental
1: Control component
2: Manipulation component Expt. Treatment only is Manipulated
3: Observation component Careful, thorough and rigorous methods of measurement
Law of the single variable: apples in laboratory expts.
2: Manipulation component Expt. Treatment only is Manipulated
00
Experimental
1: Control component
2: Manipulation component Expt. Treatment only is Manipulated
3: Observation component Careful, thorough and rigorous methods of measurement
Law of the single variable: apples in laboratory expts.
2: Manipulation component Expt. Treatment only is Manipulated
3.3Threats to Experimental Design Studies
In order for an experimental research study to achieve its paramount goals of enabling the researcher make accurate and valid predictions and explanations of events or dependent variables with regard to their causality and so on, the activities which constitute the research itself must possess a high degree of validity and reliability. It may not have reliability and validity if the experiment is subjected to threats, there are two classes of such validity threats. These are internal validity threats and external validity threats.
Internal validity threats to experimental studies are those factors or activities which mitigate, confound and influence the manipulated independent variable of an experiment to the extent that its effects on the dependent variable are ‘altered (enhanced, removed or minimized). Therefore, an experimental study has a high internal validity, if threats which may mar the effects of the independent variable on the dependent variable, are removed or severely minimized. When internal validity threats are enhanced, removed or severely minimized, it would be possible but clearly wrong for the researcher to assert, that it was the experimental treatment that brought about the change in terms of (the observed outcome) its effects on the dependent variable. An assertion which is accurate, verifiable and sustainable in this regard, can only be made if adequate and necessary controls, manipulation and observations, have been carefully thought through and systematically carried out. If the three major characteristics of experimental research (controls, manipulation and observation), which were’ discussed in the preceding section, are accounted for, then the internal validity threats or extraneous variables which mitigate, confound and influence the effects which the independent variable has on dependent variable are removed. Generally, eight internal validity threats or extraneous variables have been identified to have serious alteration or confounding threats to experimental research in education and social science. We will discuss the internal validity threats, first
Pretesting: Pretesting which is the administering of research test to subjects before the actual commencement of a study, sensitizes them to become aware or suspicious of the purposes of the pre-testing aspect of the experiment. In educational settings most students prepare for their examinations from previous years’ examination/question papers. So having been administered a pretest, most students revert to preparing for the posttest by revising questions of the pretest. Ali (2oo4) has reported that at all levels of education, evidence shows that pretest questions are carefully, repetitively and methodically studied by students prior to the posttest, almost to the extent that any observed improved •performance on the posttest by the student subjects may well not be because of the effects of the experimental treatment, partly due to their previous level of preparation. Designs of experiment which have pretests suffer from this internal validity threat. Another source of threat has to do with the newness effect of pre-testing on the subjects. Some subjects may read meanings into the newly introduced pretest which is not normally done in the class or in the community and so become sensitized to the test and react more to it than to the experiment. This phenomenon is commonly referred to as the reactive arrangement or reactive effect of pre-testing on the subjects. Some researchers have suggested that reactive effect of pre-testing can be minimized through scrambling of the posttest items administered to subjects at the end of the experiment. Scrambling can be achieved through renumbering of the posttest items,, using colored paper different from that of the pretest, retrieving all the pretest question papers from the students after the pretest examination, among others.
History: Certain historical and unique environmental events beyond the control of the experimental research but which may have had profound effects on the subjects can confound the effects between the independent and dependent Variable of the study/ Historical events such as human and natural disasters, tsunami, strikes, famine, calamities, economic hardship, sudden changes in -the school year or curricula, undue anxiety,, wars, sustained^ disruption to academic activities can either singly or in combination, as the case may be enhance, disturb or stimulate subjects’ performance on the dependent variable. A longer experimental research study stands a higher*chance of historical events affecting it. Therefore, an experimental study should not be unduly long. one way of avoiding this is to carry out the experiment in phases, complete each phase and report it before embarking on another phase.
Maturation: Subjects, and indeed all human beings, do change with time regardless of what treatment condition they are exposed to. Between the initial test and subsequent test, the subjects may have undergone many kinds of maturational changes since they are influenced by several factors, not just that of the experimental treatment factor. Changes include becoming less or more bored, becoming more or Jess wise, becoming more or less fatigued, becoming more or less motivated, as the case may be. And each or all of these changes may produce an observed dependent variable which is then falsely attributed to the experimental treatment rather than to the maturational changes indicated above.
Instability of Instrument: If in an experimental design study, the instrument for data collection is not valid, reliable and appropriate or if the techniques of using the instrument, as well as observing and recording the data are not consistent and systematic, data obtained from such instrument or techniques are unstable. An instrument, which is faulty, or even one that is precise and valid when wrongly used will yield unstable data. Similarly, haphazard techniques in data collection yield unstable data or data that continue to change with the administration of each instrument. Researchers should guide against any sources of errors such as instrument decay (faulty, imprecision from repeated or overuse, etc.) which poses an internal validity threat to their work. For instance, if research assistants are used for recording observed data, care must be taken to ensure that they know what to observe, when to observe, what to record, how to record, when to stop recording either because of fatigue, boredom and lack of focus on what to record. otherwise, serious errors are introduced, during the use of the instrument, into the experimental data and these become serious internal validity threats. Under no circumstance should the same assistant be used for recording observation data for experimental and control groups. Why did we make this suggestion?
Experimental Mortality: Subjects in an experimental research study may reduce in number between the time the experiment commenced and when it ended. Losses in data can arise from illness, parental request for wards, to discontinue participation, movement of some subjects to another school, unwillingness of subjects to continue with the research, and incomplete data set. Imagine that in a study almost all the losses through mortality, were subjects in the experimental treatment group who had scored low in the pretest. Because those remaining subjects did well in the pretest, they would, most naturally do well in the posttest, not so much because of the effects of treatment as much as the fact that those students who scored low in the pretest did not do the posttest. Mortality is a problem in experiments which span for long periods.
Statistical Regression: If subjects are grouped on the basis of their pretest scores in addition to the interactive effect between pretest and posttest, there is also the problem of statistical regression. Statistical regression is a phenomenon in a pretest- posttest experiment in which extremes of data do affect the gain scores or the results that subjects of the experimental treatment (e.g. research evidence shows that the same subjects who have low pretest score do end-up having high posttest score) whereby the higher gain scores may be misjudged or misinterpreted as arising from treatment effect. The truth of any pretest-posttest design is, in part, that subjects in any comparative group who score highest on the protest are likely to score relatively lower on the posttest while subjects in any research group being compared who score lower on the pretest are likely to score higher on a posttest. Thus, the researcher should be aware that the subjects who scored lowest or highest in the pretest are not necessarily the ones that are going to be the same lowest or highest scoring subjects on the posttest. Therefore, regression as an internal validity threat occurs inevitably in any pretest-posttest design essentially because there is usually a regression of pretest-posttest means of the subjects toward the overall mean of the entire experimental group. Superior gain score differences between treatment and control groups may well not be a direct and entire consequence of the treatment effect on the experimental groups. In fact, gain score differences between groups are always affected, by regression, in any pretest - posttest design study.
Selection Biases Arising from Differential Selection of Subjects: Even when a researcher may not be aware of this, when he selects and groups subjects, certain criteria unwittingly influence who he selects and puts in a particular research group. When this happens, as it is bound to happen, there is the occurrence of none equivalent grouping of subjects prior to the commencement of the experiment. The general tendency, among unwary researchers, is for selecting and assigning better subjects into the experimental Group advantage, which enables these better subjects to do better them the control group subjects who were worse candidates before the commencement of the experiment and who, in any case, would be expected to perform worse at the posttest than- their experimental group counterparts. Under this condition, the researcher selection biases threaten the internal validity of his results since his results may well not have been caused, by the restraint but more so them the fact that, absent initio, the experimental subjects were favored and consequently performed better than the control group subjects and so, as would be expected, did better than control in the posttest result.
Influence of Earlier Treatment Experiences: Many researchers use subjects whose earlier history to exposure to other research -conditions they do not know of or care to find out. Such earlier research treatment influences may well affect experimental research findings either negatively, positively, or selectively to members of a particular comparative research group. For instance, a researcher may unknowingly use and group into experimental group I, more subjects who had just finished an earlier experiment on Communicative English Language Reading and therefore have more reading skills than the control group subjects most of whose members did not participate in the reading experiment project earlier completed by those who participated in the earlier study mentioned. Because of this earlier treatment exposure of reading skills on some subjects and none for their counterpart subjects, there is already an abolition introduction of unfair advantage conferred on the experimental group subjects and unfair disadvantage on the control group. So, on any research study the former are used for, involving reading, an undeserved advantage is conferred on them while for the latter an undue disadvantage is conferred on them in later experimental work involving, earlier treatments such as word problems, as in mathematics, English language and so on. To avoid this problem researchers should find out about earlier experimental experience of their proposed subjects so as to ensure that these experiences ^ fairly or evenly well distributed in the population they want to work with, and they can then randomly sample from that population.
External Validity Threats
External validity threats are those factors or events which affect an experiment and which minimize a study’s usefulness, relevance and practical applications of the results so much so that the results and conclusions of the experiment cannot be generalized to the real world; what use is an experiment to man if its findings have no practical value? Therefore, before embarking on a study, the researcher must ensure that the ultimate results of his work should be useful, relevant and of practical application to the social science and educational setting, by asking himself such questions as: To what real populations, school settings, administrative or social group settings, political settings, experimental variables, measurement variables, research analytical variables can the research findings and conclusions of my proposed study be generalized. If the answers to each of these questions is none, then the researcher should not embark on his proposed experiment. Even when his findings and conclusions are generalizable to the population, there are factors which threaten the substance of such generalizations. He must take care of the factors which threaten the study’s external validity (extent of generalizing one’s research findings to the overall popup these threats are discussed below:
Hawthorne Effect: situation under which experiment in education and social science proceed need to be controlled so that experiment can go on as naturally as possible rather than their going on under contrived conditions or because of subject’s response to novel conditions induced by an experiment. When experimental conditions are not adequately controlled, subjects’ reactions and responses to experiments may become distorted by the mere fact of the introduction of the research conditions. By subjects becoming aware of the new situation created by the introduction of an experiment in their class, village school, football team and so on, they may become resentful, feel preferred, feel rejected or inferior to other research group or even the population that was not used; some subjects may question, why us, not them? Any of these reactions and responses may leave some effect on the subjects. The effects such responses have would depend on how the subjects were affected by the newly introduced research-induced situations. Subjects’ knowledge of their participation in an experimental treatment, as the treatment group, may engender their contrived or biased response to the introduction of this new situation rather than as a result of the effect which the newly introduced experimental treatment had on the experimental group subjects. When subjects respond to the newness effect of the experimental treatment rather than to the experimental treatment itself, this is referred to as Hawthorne effect and it is a serious external validity threat to an experiment. Similarly, when control group subjects respond to their knowledge of the fact that nothing is done to them (they are the control) while something is done to their treatment classmates, they become non-challant about the research study or they become uncooperative with the researcher and his work. Such a non-challant response arises not as a result of the control condition but more so as a result of knowledge that nothing was done to them or happening to them. This response is the placebo effect on the control group subject. Hawthorne effect was first observed in 194o following experiments done at the Hawthorne Plant of Western Electric Company in Chicago and reported by Roethlisberger and Dickson (194o). In this study, the lighting conditions of three departments in which workers inspected small parts, assembled electrical relays and wound coils were gradually increased. It was found that production in all the three departments increased as the light intensity increased. After a certain level of high production level was reached, the researcher progressively reduced the intensity of light in the departments to determine the effect it would have on productivity. To the surprise of the experimenters, they found that productivity continued to increase. The researchers then concluded that the newness effect of introducing light to the employees and the mere awareness of their participating in the study, rather than the experimental treatment of increased lighting conditions led to the increase of production gain; the now so-called Hawthorne effect. Further experimental studies of the above nature done at the plant, using varying rest periods and varying the length of working days and weeks, respectively, produced the same Hawthorne effect. The reactive effect of subjects to the newness of an experiment has also been observed in medical research. Medical research subjects generally react to whatever the drug they receive is as treatment, regardless of whether the drug is the real one being tested (and which contains the pharmaceutical preparation) or the ones which are placebos (these are inert, harmless and blank drugs but look like the one containing the required pharmaceutical preparation being tested). By masking the real drug (experimental) from the inert ones (placebo), researchers are able to reduce subjects’ reactive effects to the experimental treatment since they do not know which drug is the potent one and which one is placebo (inert, harmless and blank drugs which looks like the potent one but which are actually worthless mimics, (the placebo). Again, if it is concealed from the subjects, i.e., the knowledge of who is in the placebo or experimental condition, at the end of the experiment, based on the observations made on both groups of patients (note that the experimenter does not participate in the study, a condition referred to as double blind), it is possible to determine how effective the experimental drug is compared to the placebo. By doing this, the problem of some patients reacting to the newness effect of the study than clinically to the potency of the drug used as treatment received (most people tend to feel better or say they feel better after they received drug treatment, regardless of the efficacy of the drug used) is minimized. But in education and social science research, we do not have the luxury of placebo, i.e., not administering anything to student subjects in the school in the control group or even worse, administering of fake control conditions to them. It is possible to minimize Hawthorne effect and other situations which contribute to external validity threats. Clearly a phased-in, fairly longer study, say, five to twelve months, would reduce the newness effect, by wearing off subjects’ reactive effects to treatment, thus eliminating Hawthorne effect. But it is unwise to do so because longer studies lead to mortality, maturational, and historical problems which then constitute themselves into internal validity threats. A more useful suggestion that minimizes Hawthorne effect and other situational external validity threats is to hold all the situations affecting experimental and control groups constant; randomly draw and assign treatment and control conditions to groups; do your best to manipulate subjects to the extent that they do not know that any research work, as far as the independent variable is concerned, is in progress. There are several ways of holding experimental research conditions constant for all the subjects in an experiment. These include treating them alike on all things and letting them know that this is so, except with regard to the treatment aspect of the independent variable. For instance, on a teaching effectiveness method study, duration of teaching; actual teaching time; teacher qualification and personality; topics covered and their scope; tests; apparatus used; language of instruction; learning environmental conditions, etc. must be identical for experimental as well as the control group. Again, if assistants are used in the research, they must be trained on what to do, how to do them with little distraction and how to do them effectively. They can be brought into the class or community where they will assist in the particular research study far in advance of the commencement of the experiment, so as to minimize the newness effect of their presence in class or the community during the actual experiment, since the subjects would have become used to them, with time.
Population Validity: In order to be able to make a valid assertion, based on one’s experimental results, about the population, the sample used in a. study must by typical of the population from which it was drawn. Sometimes, the population experimentally accessible (accessible population) to the researcher may not truly represent the typical population; for instance, primary school children from rich and affluent homes of Victoria Island, Lagos, do not typically represent the primary school population in Nigeria but the former group may be the only one that is readily accessible to the experimenter. Any generalization to the Nigerian primary school population based on samples drawn from experimentally accessible population creates external validity threat. on the other hand, a use of target population would permit valid generalization, based on samples drawn, about the target population. Target population is the typical population to which the researcher wants to generalize his conclusions and, consequently, draws his sample from that particular identified target population. Sample for a target primary school population would include pupils from a variety of socio-economic conditions; schools and pupils from all the different parts of the country; a variety of school types and so on. Usually, to obtain a sample which reflects the target population is difficult. This can be overcome by identifying the population, the major attributes of the population and using the specific attributes of the identified population as sampling frames, zones and or clusters, from each of which sample representatives of the population is drawn. For instance, if there are three categories of primary schools in Nigeria, say, well established, less well established and poorly established primary schools, each category is listed and its population and samples representing the three categories of primary schools are respectively drawn. If location is an important variable or attribute, then Nigeria may be zoned first into, say, five equal locations, clusters or zones, and primary schools belonging to the three categories mentioned earlier are identified and then randomly sampled from, i.e., each of the sampling frames, geopolitical zones or clusters into which the country was divided.
However, there is a problem about the suggestion made above. It is that of logistical convenience. Clearly, zoning, sampling, identifying population criteria of a very large country and sampling from identified criteria is a difficult time-consuming task; difficulty whose implications/are enormous in terms of time, cost, ability to manage the conduct of the study and so on. Despite these difficulties, if a study is going to be generalized to the target population it is better to have reliable knowledge about a more restricted population of this target, even on a zone-by-zone basis (although even in the zones some areas may not be included in the sample) than to have a far more restricted unrepresentational sample (pupils of primary schools in Victoria Island, Lagos). Certainly, it is wrong and misleading to use conclusions generated from studying unrepresentational sample; samples drawn from experimentally accessible population cannot yield data that can be reliably used to make generalizations about the target population.
Experimental Environment Conditions: The conditions under which experimental research takes place is equally important as the experiment itself. Extreme variations in the environments of different schools, home, communities, cities, and tribes, programme administration may singly or jointly influence outcomes of experiments. Similarly, outcomes of experiments influence school or community environments. However, what is important to the researcher before proceeding with his research, as far as the experimental environment of his study is concerned, is in his making sure that the environment implicit in his study are those existing or attainable in typical schools, community, home, etc. in the area he is doing the study. An experimental environment in which calculators, photomicrographs, computer simulated teaching episodes, or strange external research officers in a village etc. are used in, are not typical environments, except in rich, well-established suburban primary schools (and these ignore the rural, depraved schools, or situations rural folks may not be able to handle).
Finally, all the types of threats discussed in the foregoing section highlight the enormity of demands, involvements and expectations of work that is of experimental nature, in education and social science research. Knowing what these threats are, is important. But far more important are ways and means through which the researcher can control and minimize, if not eliminate their effects, on the experiment carried out. These specific ways and means have been described in this section. Having indicated the design of experiment for the study you want to undertake, you must understand the implications or demands implicit in the chosen design. You should also anticipate what the threats to your experiments are likely to be as well as how the potential threats will be minimized, if not removed.
3.4Types of Descriptive Research Design
Having discussed the different types of experimental design, their characteristics and threats to their validity, it is only fair that we give equal emphasis to types of descriptive research designs in this book. It is as well fair that we do so because a large number of studies in education and social science use descriptive designs. The need for understanding them and how to improve on them is therefore, important if their sustainable and useful knowledge value and contributions to education and social science are to be enhanced, for entry-level researcher, it is the firm belief of this author that the comprehensive discussion of types of descriptive research design, with regard to their nature and scope, will help in the envisaged enhancement. Consequently, we will for now discuss survey, case study, evaluation and causal-comparative designs, even though there are other types of descriptive research design, such as gallup poll, correlational studies, ex post facto studies, market research, impact studies, evaluation studies, longitudinal studies, and so on. We will discuss this other design separately but more briefly.
Survey: A survey is a descriptive study which seeks or uses the sample data of in an investigation to document describe, and explain what is existent or non-existent, on the present status of a phenomenon being investigated, in surveys, views, facts, etc. are collected, analysed and used for answering research questions. Typical surveys develop a profile on what is and not why it is so; they do establish not relate one variable to another. Rather, information is gathered on the subject of investigation and described. For instance, Census of a country’s workforce population is a survey to find out attributes and number of people in a particular region, state, area, country who have or do not have jobs and so on. Such data can be used for problem solving, planning, electoral office zonal allocations based on population number representations, and so on. Some surveys measure public, opinions on major burning, social, political and educational issues. There are therefore a wide variety of survey types. These include, for instance, a census of tangible subject matter; a census of intangible subject matter; a sample survey of tangible subject matter; and a sample survey of intangible subject matter. In the census of tangible subject matter, a small sample is used for seeking information on a single subject or issue at a particular time. An example of this is a census of the number of professors at the Ambrose All University, Ekpoma, Nigeria, in 2oo6 or the number of senior lecturers in the Faculty of Law at the University of Lagos, Lagos Nigeria, in 1999. It could also be the number of Nigerian master’s degree candidates produced from 199o _ to 1999; disciplines at the University of Nigeria, Nsukka, Nigeria. Information gathered from census of tangible subject matter is “definitely useful for planning, albeit, at the local level, despite its confinement in scope. In a census of intangibles, a survey is undertaken on several issues from which a construct is derived indirectly. A construct such as the center of excellence in law or the best university in Nigeria would involve deriving this decision based on ranking all Nigeria Universities on observed survey records of their performance. Ranking will be based on several academic and non-academic criteria such as stability/staffing, quality of staffing, staff-student’s ratio, library facilities, research capability and output, laboratory facilities, municipal services, students’ academic records of performances, academic award, growth rate, staff academic publications abilities, age, landscaping of grounds, safety and security of university and so on. So, you would expect that census of intangible subject matter poses many difficulties. For instance, based on the examples noted above, there is the difficulty of developing valid and reliable measurement criteria and instruments satisfactory and useable in all the universities to be surveyed. There is also t e problem of whether one can reduce census of intangible subject Matter data into a construct (e.g. best university, the best study? whose meaning is clear to and acceptable by all persons survey Again, constructs vary from place to place and even in on they vary from time to time and one person to and observation is largely responsible for our inability to successfully and satisfactorily develop and use instruments for measuring many constructs in social science and education. Indeed, to date, constructs in social science and education such as attitude, interest, psychological adjustment, reinforcement, cost and benefits of a social programme, leadership, student motivation effective teaching and so on have not been rigorously defined and become acceptable frame of reference for these constructs and agreed upon by all. In a sample survey of tangibles or tangible subject matters, a researcher investigates quantifiable phenomena using a large sample. An important sample survey of tangibles was the Lunge Report (1991) commissioned by the Federal Government of Nigeria to advise it on many issues related to funding higher education with particular reference to Nigerian universities so that they can better perform their statutory functions of teaching, research and public service. Another important example of a sample survey of tangible subject matter is the Coleman Report (1966) which was a survey of 600,000 children in grades 1, 3, 6,9 and 12 in approximately 4ooo American schools (largely representative of American private and public schools) to find out the nature and scope of educational opportunities, offerings and facilities in these schools. The findings of this sample survey of tangible subject matter led to the establishment of information on the relationship between a school’s geographical location and its measure on the factor of facilities, class sizes, educational opportunities, teacher qualifications, course offerings and so on. Such information was used for planning and redressing the ills arising from the observations of disadvantage in schools in particular geographical location including rural schools in the Deep South that were mostly disadvantaged because of their isolated locations, in a sample survey of intangibles, an attempt is made to reach a psychological or sociological construct by sampling a large population and deriving from the data obtained, some information about the particular psychological or sociological subject matter that is of interest to the researcher. For instance, how someone is aging to vote is intangible; so also, is what car he will buy or his opinion on sex education in schools. But these constructs - political references, buying tendencies, and sex education preferences and so on must be measured. These are difficult constructs to attempt to survey and establish but researchers undertake them because of their immense usefulness to society. Voting preferences research studies have become more and more accurate as a result of speed in 5 telephone data gathering techniques, careful and representational sampling techniques and computer-assisted techniques in speeding up and accurately reporting data. It is indeed now possible for predict the outcome of an election and opinion poison any issue based on preliminary sample result. Based on the observed polling tendencies of a few precincts (polling stations) in some states in America (Eastern states), it is possible to accurately predict presidential elections even when elections are still going on in Western states. There are four time zones in America (Eastern, Central, Mountain and Pacific), with an hour differential between time zones; in effect once, elections are concluded and counted in the Eastern and Central » time zones, prediction about the outcome of the election are made by the media and pundits. Such predictions are always very accurate. Prediction based on polls are more likely to be accurate if the number of undecided responses is small as not to tilt the direction of preference. So, if the number of undecideds is too large, the chances of making a wrong prediction increase. Ali and Design (1985) have reported that even though survey results can be abused and misused, survey research is very useful in educational and social science planning and development. But as would be the expected, a large number of survey studies in education and social science are sea e parochial, and inconsequential investigations and have en one y undergraduate research students who usually over a particular area and use less than adequate research skills and instruments in doing so. Many principals of secondary schools have become peeved and indifferent to responding to questionnaires on leadership styles; indeed, some prepare and keep in their drawers or minds, answers ready for the next set of student-researchers’ questionnaire. Little wonder then that there is a lot of distortions in questionnaire data arising from arbitrary responses; small number of responses; error in analysis and sometimes introduction of researcher biases for political and economic gains. Indeed, this last disadvantage (among others) to survey studies have been largely leveled against some pollsters who “fix” figures to attempt to win elections for favored politicians who (they show as leading in polls even before elections are held; an indeed a sordid interference. But the author and perhaps many other researchers have faith in survey studies. What is needed to make them more valid, more reliable and. ‘more useful for educational and social science planning and development is to sharpen the research skills and perceptions of researchers planning to undertake surveys in these areas. A simple rule of the thumb is for the researcher to fully know the nature and scope of the problem he is investigating; the identification of the particular useful sources of data; obtaining full cooperation from the data source, developing and using relevant and reliable instruments for data collection; carefully collecting data from a properly composed large sample; and analysing and interpreting the data correctly for answering research questions related to the problem investigated. In some cases, the researcher must use a guide or assistant familiar to a research situation and good public relations to seek and obtain survey information useful in his study. This is very true of survey studies in which interviews are involved.
Case Study: A case study is an in-depth intensive investigation of one individual, a small unit or a phenomenon; a small unit could be a family, school, a church, a disability class, an economic regime while a phenomenon could be the impact of unemployment among coalminers in a town, say, Enugu. The case study approach as a means of documenting social reality, lifecycle, change or growth has a long history. Ancient Greeks based much of their logic on close one-on-one observation of individual events, etc. as a basis for logical conclusions upon which their theses or most decisions or facts about different subjects depended on. Despite the fact that a large number of earlier case studies in education and social science were unscientific, mainly because of their lack of depth and rigorous research controls, its humble beginnings and contributions as one of the major tools of researching and revealing human events and changes as well as how children learn must be appreciatively recognized. Indeed, one would say, that the nature and scope of human intelligence and behaviours, as we have found out, has become unquestionable based on case study research. For instance, much of the work of Sigmund Freud, Jean Piaget and a host of their followers were case studies. And from these case studies, educators, psychologists, economists, sociologists etc. have indeed learned a lot about human behaviours, growth and development. The underlying rationale for case study is the belief that probing and studying intensely one typical case can lead to insights into our understanding of other identical or similar individual cases, events, and social units, etc. typical to the particular case studied: if you study one case, you have by implication studied others similar to the one case studied. Clearly, this poses the problem of determining what is the typical case, event or social units that should be studied especially with regard to how typical is this one case, etc. vis-a-vis the other cases (ensuring that the particular one investigated must be identical to the others not investigated). There is no one way of knowing how representational the one case studied is to other uninvest gated cases; it is not entirely likely that the one case studied has all the attributes or characteristics of the other cases in the population not studied.
This problem can be overcome i f carefulness anti thought fullness are exercised in selecting a case for investigation so that whatever case is selected would be a fair and adequate representation of a whole range of cases similar to the one being investigated. Even when lilies feature is not attained by the researcher, it should be borne in mind that a case study is not an experiment and conclusions from it cannot, with great certainty bemused for prediction or conclusion about other cases. one case cannot be generalized to all the other cases or for establishing causation. Case study approach demands intensive and extensive data collection work, the more thorough and’ systematic the instrument, developed and used for case study data collection is, the more useful and sustainable is the case study. Data collection instruments are of various types and largely depend on the type of issues addressed in the case study involved. In the historical case study, documents, artifacts, memoirs, interview and questionnaires, may be used to find out from subjects the historical growth and development of a particular issue, event, school. For instance, a case study can be done on the history and development of Mayflower College, Ikenne. Documents of historical significance may be collected from Newspapers, courts, personal and old boys photo albums and from records kept in the school. During visits to such a school, the researcher can cross-check or match information with - actual scenes, places and -objects. In situational exam malpractice case study, the researcher looks at the scripts of the candidates and interviews those directly involved in examination malpractice, as Well as interview those not directly involved in the subject-matter of the case study. Those not directly involved may include other students who sat for the examination but were not involved in the examination malpractice, malpractice-involved student suspects’ academic records, examination invigilators’ reports, and so on. Clinical case study involves investigating a child with a specific social, emotional or learning disability problem in which the researcher would generally employ the clinical interview and record keeping observational technique. It could also involve some testing, interviewing friends, and looking at the subject’s previous work record. From all these stores, a diagnostic prescriptive data profile is built up for the subject for use in rating the occurrence, frequency and severity of a particular phenomenon being investigated such as a deaf pupil’s response to tactile (touch), mode of learning the structural features of plants. Such a profile is then used to effectively teach him, on a one-to-one basis, especially because the teacher has diagnostic and prescriptive information about the particular child.
Case studies have been successfully used for investigating a wide range of individual’s behaviors and preferences, socio-economic Events, geographical phenomena, cities and so on. Social case study issues include, Siamese; twins, gifted children, alcoholics, fibrates or nomadic persons, Quakers, American Indians, poor whites, absenteeism, armed robbery, death penalty and so on. Indeed, many case studies on urban change, such as those by Lucas (1999) and Momoh (2oo4) have cumulatively lead to the acceptance of hypothesis on urban- rural migration and development. Despite its usefulness in developing” our understanding of certain events and the vast range of appeal it offers in terms of large number of uses which it serves case study approach to research has some limitations; indeed, it may be that its strength provokes and creates its weaknesses. Because the case study emphasizes in-depth investigation, by doing this, they inevitably lack breath; when we dig deeper, we lose vision of what is on top and beneath other areas we % did not dig. Also, because of the opportunities to really dig deep on a case study problem, on a one-or one basis, there is the danger of researcher subjectivity and too much closeness with the subject of investigation. So much is this possibility real that he becomes a victim of his own prejudices, fears, mannerisms and other personal factors rather than working objectively with the subject. The case
study research approach may appear simple but in reality, it is difficult, strenuous and time- consuming, given that volumes of data are collected through painstakingly methodical, and skill-demanding counseling sessions, data sifting sessions, travels and so on, each of which requires efforts, skills and patience. Because of the technical procedures of case studies and the fact that some researchers who use this design must be familiar with and use terms applicable in their profession such as in Psychology, Economics, Political Science, Education, etc., there is often the tendency for some case studies to be reported in constructs, terms, principles, behaviours, etc. that are undecipherable, difficult to confirm or refute through replicating the same case studies, let alone doing so through empirical experimentation which may be an inappropriate design for use. Some ease studies have tended to wrongly project their results as causative rather than those results merely being predictive or associated with the observed phenomena. If, for instance a researcher studied the influence of different noise levels on a student’s achievement in Mathematics and found that sonorous low-level noise resulted in the student’s better results in Mathematics, a conclusion of sonorous low-level noise causing superior achievement in Mathematics is spurious. This is because, at best, this level of noise is related to but not the cause of superiority of Mathematical achievements among most or all students. Any effort at establishing causation based on a case study research conclusions result in Post Hoc Fallacy and this issue we will be discussed in the next section of this chapter.
Causal-comparative Design: For one to reach a conclusion that one variable (X) causes another variable (Y); three necessary preconditions must be fulfilled. The first precondition is that statistical relationship between X and Y has been established through alternative hypothesis testing that was upheld. Secondly, it must be the case that X variable preceded Y variable in time. The third condition is that all the threats to the study have been taken care of through randomization, proper manipulation of treatment within the experimental controls, careful observation techniques and the careful and accurate manipulation of independent variable. Without these preconditions met, there is no way the researcher can authoritatively claim that X caused Y. only a true experiment satisfies these three necessary conditions which is why it enables us to make inference of causality between X and Y„ following the acceptance of a tested alternative hypothesis. Rarely in social science and education research is it possible of practical and even thinkable to undertake experiments which would enable us fully and absolutely meet all the conditions of Controlling X, i.e., control all independent variables c (intelligence, attitudes, preferences, aptitude, motivation) as we hold all other variables at bay or constant while determining through experimentation; their effects on Y (dependent) variable. When such controls are not possible, we can investigate the relationship between X) secretively rather than through experimental design studies. In Joining this, a descriptive study where X and Y are observed and reported without X being manipulated to determine its effects on Y, is not an experiment. Any relationships between X and Y observed and reported were pre-existing in the subjects and so X did not cause Y. A descriptive study, which determines the relationship pre-existing between X and Y is referred to as Ex Post Facto or causal-comparative design. For instance, a researcher may notice a particular event (tallness) among his physics students and observed that- such students do well in physics. In a causal-comparative design study, he would sample a group of tall Physics students and another group of short physics student and test the groups on a physics achievement test. Using at test statistics o^ comparison of the significant difference between the two-groups dependent means, he may, in fact, find that a significant difference occurred between both means, in favor of tall students, us significance enables him to establish that a positive relationship exists between height of students and their academic achievements in physics. As noted earlier, the design here is Ex Post Eaclo or Causal Comparative. Note that he cannot establish a cause-effect relationship between tallness and physics achievement because he has not manipulated height experimentally, and controlled or kept all other variables at bay, to determine the effects of height on students’ achievements in physics. one of the most unfortunate problems of undertaking an ex post facto or casual-comparative study is the danger of using findings based on an ex post facto or casual-comparative design as a basis for reaching a conclusion of causality. It is wrong to do this. When a researcher does this, the problem of falsely making a causality conclusion rather than a relationship conclusion, based on the findings in an ex post facto or casual-comparative design study, is referred to as Post Hoc Fallacy. Even when there is a high and significant relationship, as measured by subjects results on a dependent variable, all we can establish in an ex post facto design study is that the independent and dependent variables are positively related; note very clearly that the independent variable has no effect on and does not cause the dependent variable. Two classical examples of Post Hoc Fallacy are The Car Seat Belt Research Studies reported by the Volvo Company in Sweden and made public in 1968 by the U.S. and World Report (January 29, 1968, page 12) and the numerous cigarette-cancer studies. In the seat belt research studies, from the evidence available it was concluded that in road car accidents, seat belts reduced 69% of skull damage among drivers and 88% for passengers and, again, that seat belts reduced facial injuries by 73% for drivers and 83% for passengers. Clearly, the distinction must be made that seat belts are closely related to reduction of danger of life during vehicle road accidents but are not the cause of such reductions. other factors (road conditions, human luck, the response of driver to an appropriate and equally, if not more so. contribute to and are closely related to road accidents End death? from automobile accidents compared seal belts alone. The conclusions of the Volvo studies reducing roads and road accidents led to the present mandatory of seatbelts on all U.S cars. The mandatory installation and use of-seat belt on all cars in Nigeria, as from January 2oo3, while driving- may well have reduced or led to the reduction of accidental injuries and deaths during car accidents. As you would expect, it may have added more cost to car buyers at a time injuries sustained from car accidents may have reduced because most people who put on seat belts while driving are consciously careful, and putting on a seat belt subconsciously evokes carefulness in one. While driving, anyway. If some measure of driver’s carefulness occurred before the accident, it is as well expected that injuries would decrease among car seat belt wearers who are the ones careful driving their cars, to begin with, anyway. With road safety agencies in Nigeria free to thrive on brute force in their so-called road safety operations, it is understandable why research hardly plays any role in guiding their behaviors on the job and professional responsibilities. It would have made more sense if Nigerian road safety agencies carried out simulated experimental studies on what causes road accidents in the context of treacherous Nigerian road conditions that need no description and painstakingly address the causes than merely ignorantly enforcing seat belt use while driving. Clearly these agencies need to know that conditions that cause road accidents and death from injuries are, all too often beyond the entrainment of a driver and or his passengers, by seat belts. The outcomes of studies on cigarette-cancer dimension again have established spurious cause-effect relationship between both even though we should know better. Recent clinical studies in Germany and the U.S. have shown that certain persons have glandular imbalance which has clinical tendency to cancer. Glandular imbalance, clinical research shows, induces a certain amount of nervous tension. Since excessive and sustained smoking of cigarette is a type of nervous’-tension release, it is therefore not surprising that such individuals who have glandular imbalance smoke heavily. Again, as would be expected, cancer could therefore result from the glandular imbalance which was in the smoker before he even began smoking, rather than from the smoking which is a type of symptom. Also, note that all cancer patients did not smoke and all those who smoke do not have cancer.
This error in making false and misleading conclusion of cause-effect relationship between cigarette-smoking and cancer is only now beginning to aid and broaden our understanding of the nature and scope of relationships between both cancer and smoking and the kinds of psycho-clinical treatments useful in stopping the cancer symptoms by treating the glandular imbalance first and then getting the smoker to stop smoking. It took us this long to also know that lots of people who develop lung cancer do not smoke or have never smoked before! Also, we have found that most smokers do not have lung or any cancer! Nonetheless, because smoking cigarette and indeed tobacco, is closely associated with many forms of respiratory ailments1, among others, a wise smoker needs to quit-smoking to avoid making himself a highly potential or vulnerable victim of such ailments, as he gets older.
From the foregoing, it should be apparent that there is need for caution whenever ex post facto or causal-comparative design is used in a research study. Caution is necessary so that the researcher is aware of the difference between—causation and prediction. only findings based, on experimental design studies can enable the researcher reach conclusions for establishing causation (cause-effect relationship between X and Y variables). Ex post facto or causal-comparative design merely enables us to establish a relationship between X and Y (i.e., X and Y go together) in which case X predicts Y, but X docs not cause Y. once these sequences are understood, actually, there is therefore no worry about Post Hoc Fallacy or the establishing of a cause-effect relationship where none exists.
Ex post facto or causal-comparative design is quite useful in educational and social science research as a means of undertaking studies in which independent variables among the subjects (aptitude, personality, age, teacher competence, preferences,, prejudices, intelligence, cultural traits and so on) already exist and cannot be manipulated or controlled for or in studies where subjects possessing these variables, at different and varying degrees, cannot be randomly assigned to treatment groups. It is also a design which allows the researcher to proceed with his work by looking at only one and independent and dependent variables at a time even though it is obvious that in real life seldom is one variable only (X, alone) related to another variable (Y, alone), while other variables arc held constant.
Which Design Should I Choose
In the earlier sections of this chapter, we discussed a number of the different kinds of experimental and descriptive designs. Clearly, we did not exhaust them and indeed no one book on research exhausts all the very many research designs there are. With more and more advances in research techniques, new but hopefully better designs are bound to emerge.
Because there are many kinds of experimental and descriptive designs, the researcher is sometimes confronted by the problem of choosing a research design which he deems appropriate and adequate for use in his research work. There are a number of important considerations which should guide one’s choice of an appropriate and adequate design for use in research. The first of these considerations is a clear understanding of what the aim of the study is. If one in intending to find out or establish an erasure effect relationship between X and Y variables (independent and dependent variables) and in which X is manipulated to find its effects on the dependent variable, experimental design is called for. This is because experimental designs provide the only systematic, scientific and incontestable basis for establishing cause-effect relationship. In an experimental design study, hypotheses are stated and tested using data obtained through systematic and planned controls, manipulation and observations between treatment and control groups. Experimental data are used for accepting or rejecting the stated hypotheses. If on the other hand, the aim of the study is to describe, explain, document, or identify certain events naturally existing in the schools or one classroom, at the state education commission, or over a long period in a rural setting, or the finding out efficiency levels of agencies that conduct elections, for example, then the design called for here is a descriptive one; i.e., a survey, or a case study, longitudinal, market survey, or a historical study, as the case may be.
Having decided to go experimental or descriptive, based on the aims of your research work, as discussed in the preceding paragraph, there is then, next, the important consideration of which specific design within the experimental or descriptive broad categorization 7oU want to select and use for your proposed study. To do this, you would take a close look at the different designs within experimental or descriptive framework and make a choice. Perhaps your choice may be a post-test only, equivalent group design (a true experimental design) or a census of intangible subject matter survey (a survey design). Having made this choice, you need to be clear in your mind that, like the man embarking on building a huge mansion, you have most, if not all, the skills it will take to execute this enormous task successfully. Whatever design you choose, you must have the necessary resources of time, money and research skills preconditioned to successfully executing the demands imposed by the chosen design for the particular study. Sometimes, research students select one type of descriptive design or the other under the false and misleading impression that it is simple and easy to undertake descriptive studies. They tend to forget that descriptive studies are more than just asking subjects their opinions, views, or seeking to identify the attitudes of respondents one an issue and reporting them. Descriptive studies involve a lot of work including using appropriate sampling technique, carefully carrying out the instrument construction and validation, training of research assistants to minimize inter-rater discrepancy, while using the instrument, travels to administer instruments and retrieve them, and.so on. If one were to want to do a historical study on the roles of past missionaries and their impact on education in Nigeria, one would be quite prepared to literally spend ages sifting through useful information from archival documents (legal and legislative documents, missionary records, memoirs), interviewing many people, and several other in -built work; but on its face value, the topic seems simple enough as an easy work
on the other hand, some research students adopt a true experimental design as a show-off of their supposed adeptness at doing experimental research. Among such students, little or no consideration is given to how they would meet the demands of an experiment as implicit in the chosen design. They may not be fully aware at all that experimental research design imposes several demands on the researcher including that of randomization of subjects; identification of distinct research conditions of experimental treatment and control as well as the identification of the treatment and compliance to it, issues that demand ethical considerations; systematic development of test instruments for use in observation and recording of dependent variable; devoting time and resources to the setting up of experimental conditions in the school, laboratory, workshop or us the case may he; undertaking of u feasibility study to determine whether it is even feasible to set up an experimental condition as envisaged; knowing the kind of data to he collected and the appropriate analytical tools to use; as well as other compelling experimental design demands.
Another important consideration which should guide the researchers’ selection of a particular design for his study is that of his awareness of the advantages and disadvantages of what the study is aimed at accomplishing. For instance, a study which intends to provide a very rigorous experimental test of a cause-effect nature must eliminate the disadvantages of pretesting, selection of subjects and use of instruments whose psychometric properties are not high or even known. Therefore, the design that has a clear advantage here, vis-a-vis eliminating the earlier mentioned disadvantages, is either the post-test-only equivalent group design or the Solomon Four (Iron/) Experimental Design. because the Solomon Four/Group Experimental Design involves far more rigorous and demanding Work than the post-test only equivalent-group design, the latter should he chosen unless one is an expert researcher, only this should he settle for the latter design
When the research student has chosen a research design for his work he should then discuss ‘his choice with his supervisor. A discussion such as the one suggested here is necessary for a number of reasons. Firstly, the supervisor and his student need to agree on the design best suited for the student’s work so that there is no question of working at cross-purposes later. Secondly, the supervisor may have the need to make justified modifications, even if they are minor, to give a sharper focus to a planned study or some aspects of the research work already in progress. But ultimately, whatever design a researcher chooses is his own prerogative. This is why it is important to give thoughtful consideration to such issues which will enable him choose a design that will ensure that he successfully completes his study as well as achieve the aims of his study. Some of such issues, in addition to the points made earlier in this section include ensuring that your research title agrees with your design e.g., studies whose tittles begin with, effects of, effectiveness of, etc. are experimental, studies that examine relationships between X and Y for predictive purposes are correlational or Ex post facto, studies that survey an event over a long time are longitudinal; those that make value judgment on programmes, projects, against certain pre-determined criteria are evaluation; those that document events of the past and changes that have taken place are historical; and so on. The design selected must also agree with the problem statement, the particular research methodology to be adopted for the study and the appropriate statistics to use, as well as the relevant and related conclusions to be validly made. If you take the last issue that is the conclusions to be made, a conclusion based on a survey cannot be ascribed to causation, rather it should be totally descriptive or exploratory or explanatory. These are the reasons why the design of a study affects all aspects of any research work and due thoughts need to be given to selecting a particular design.
With regard to what you put down in your thesis booklet when you choose the research design to use for your study, you must refer to it by its specific name, e.g., the design (to be used) used in this study is correlational. Then you need to describe what the design is or involves i.e., you need the definition, given by experts of what the design is. You also need to justify the selection and use of the named design vis-a-vis the type. -of study you are carrying out. other information you would need are the purpose of using the design, how the-design would be used in the study, among other points.
Summary
Research design is a blueprint, roadmap or plan of action regarding the systematic implementation of investigation-based events which upon implementation would enable the researcher effectively and appropriately document the accurate facts about the investigated problem of his study. There are, as we discussed earlier, five components in a typical research design. Basically, there are two types of research design, the experimental and descriptive designs. Experimental designs are more rigorous and demanding because of their compelling characteristics. Certain considerations are important as preconditions to deciding on which research design to choose for a study. These considerations must be thought-through before one finally chooses a particular research design for his work.
Exercises
What is research design? Identify and discuss the importance of research design, in a systematic research process.
How was the design for your proposed research selected?
Why is a particular research design preferred to another?
List and describe three components of a research design?
Which research design would you use for your thesis and why?
Ethical Issues in Scientific Research
C.N Nwanmuo
Introduction
Many of our researches in Natural science, social science and Education involve the use of human beings to collect vital information, rights of the people involved in scientific research must be protected, chapter therefore, pointed out some of the rights of research participle to be protected. The chapter ended by discussing ethical dilemma scientific research.
The justification for ethical standards in scientific Research
The History of Unethical scientific experiments can be traced back Nazi Medical Experiments of 193os and 194os where prisoners of held in concentration camps subjected to different kinds of all treating Nazi medical experiments were designed to test the limits of held endurance, reaction to diseases and untested drugs (polite and Hun 1995). The trails of 23 Nazi medical doctors who participated in medical experiments (popularly known Nuremberg trails) lead (establishment of first ethical standard referred to as Nuremberg C Thereafter, other disciplines (such as sociology and psych° established their own code of ethics.
1o.3. Ethical Principles
Nazi medical experiment at the concentration camp was not the experiments where human rights were violated Jones cited by Alim
The Tuskegee experiment
In the Tuskegee experiment between 1932 and 1972 the US Public Health service denied effective treatment of 399 African Americans who were in the Late stages of Syphilis, a disease which can involve tumors, heart disease, paralysis, insanity, blindness and death.
The men were not told of the disease from which they were suffering and were, for the most part illiterate and poor.
The aim was to collect information at autopsy so that the effects of the disease in black sufferers could be compared with those in whites. In practice, the results at the study did not contribute to the control or cure of the disease. In 1997 president Clinton issued a public apology for these government. Sponsored actions to the few remaining survivors.
It should be noted that unethical researches also occurred in social sciences. For example, Milgram (1974) and Humphrey (197o) were social researches conducted that violation of human rights. In response to the violation of human rights during scientific research, the National Commission for protection of human subjects of Biomedical and Behavioral research issued a report in 1978. The report (sometimes known as Belmont Report) articulated three ethnical principles on which Standard of ethical conduct in research are based
Beneficence
Respect for human dignity
Justice
16.1 Introduction
In chapter 15, we described four levels of measurement together with scales for each level of measurement. This chapter focused on how to construct one of such scales, the Likert Scale. By the time you read chapter 17 you will discover that the questionnaire used for social surveys incorporate Likert scales.
16.2 What is a Scale?
Even though we described four scales that are used in measurement in the last chapter, it would be helpful at this juncture to have a simple and clear definition of a scale. Certainly, such definition will help you in the construction of a Likert scale. A scale is a device designed to assign a numerical score to subjects, to place them on continuum with respect to the attribute being measured. Scientists have so far developed different types of scales for measurement of different constructs. Examples of a scale include the Likert scale, Thurston scale, Guttmann scale among host of others.
A scale can be unidimensional or multidimensional. It is unidimensional when it measures only one dimension of a construct. If a researcher is interested in measuring one dimensions of learning, say cognitive learning of students, he has to construct only unidimensional scale (i.e one scale). Sometimes a researcher may be interested in measuring more than one dimension of a construct. In case of learning, he may want to measure affective learning in addition to cognitive or he may even want to measure the three, that is, cognitive, affective and psychomotor. For these measurements, a researcher has to use multidimensional scale with three scales each measuring on dimension of learning. This chapter considered only Likert scales and they are useful in the measure of one dimension of a construct.
16.3 Concept of Likert Scale
Likert scale is a scale named after its inventor, a psychologist called Rensis Likert, who developed it in 1932. It consists of positive and negative declarative statement (items) concerning attribute (construct) to be measured. Each statement is accompanied by five or seven response categories (options). These response categories can be “strongly agree”, “agree”, “undecided”, “disagree” and “strongly disagree. Some researchers use “very important”, “important”, “neutral”, unimportant, and “very unimportant”. others use “very adequate”, “moderately
Each response category is assigned with a numerical score. With a positively worded statement, the following response categories are quantified as follows:
Strongly agree–5
Agree–4
Undecided–3
Disagree–2
Strongly disagree-’1
If the statements are negatively worded, we reverse the coding of response categories as:
Strongly agree–1
Agree–2
Undecided–3
Disagree–4
Strongly disagree–5
Note that the numerical scores (1,2,3,4 and 5) represents the intensity of the response categories. The higher the number, the higher the intensity. The following two scales show examples of positively and negatively worded statements concerning measurement of attitude of people toward Technical Education.
People that studied Technical Education become rich in future.
Strongly agree–7
Agree–6
Slightly agree–5
Undecided–4
Slightly disagree–3
Disagree–2
Strongly disagree–1
Women should not study Technical Education.
Strongly agree–1
Agree–2
Slightly agree–3
Undecided–4
Slightly disagree–5
Disagree’–6
Strongly disagree–7
Likert scale should contain equal (or approximately) number of positively and negatively worded statements. The idea behind this suggestion is to eliminate bias in selection of the responses. To measure a construct (variable) using Likert scale, the. measurer provides a series of positively and negatively scales items together with their respective response categories. Respondent selects one response category for each scale item. The numerical values corresponding to the response categories selected are sum up to represent his or her attitude toward the construct or variable understudy.
Let us use a hypothetical example to illustrate the process of measurement of attitude using Likert scale. Suppose in an effort to measure the attitude of Nigerians toward Technical Education, a researcher developed four-item Likert scale shown in table 16.31. Let us assume that the table represent the response of only one research participant.
Table 16.31: likert scale for measurement of atitude of Nigerians toward Technical Education

Key
SA = Strongly agree
A = Agree
UD = Undecided
D = Disagree
SD = Strongly disagree
√ = Selection
Looking at table 16.31, one can see that it contains equal number of positively and negatively worded scale items. It should be noted that in practice we do not show the direction of scoring on the scale. I only showed such direction for clarification purpose. The total score of the research participant is 4 + 4 + 5 + 5 = 18. We can see that in this example, individual’s scores for each item are sum together to get the final score (18). Hence, Likert scale is summated rating scale.
16.4 Writing Scale Items and Response Categories
Scale items and response and response categories a like scale. Therefore the abilities of a likert scale to measure dependent on how well you construct them. Beginning researchers often asked:
Where do I get my scale items?
What and what should be included in my scale?
How may scale items make up a Likert scale?
How do I measure a construct more accurately?
There are many sources of scale items. These include review of literatures, reading theories or conducting focused interviews. A researcher may decide to use readymade scale items suitable to his research, modify existing scale items to suit his research or generate new ones. Before selecting scale items to be included into a Likert scale, a table of specification should be constructed. one of the remaining question is answered in next section while the other in chapter 17 and 32.
16.5 Steps in the Construction of Likert Scales
Construction of Likert scales involves the following steps:
Compilation of scale items
Administration of the compiled scale items to a random sample of respondents
Determination of discriminative power of items
Selection of scale items
Test of Reliability
Compilation of Scale items
once the construct of interest is identified, the researcher compiles a series of scale items together with their response categories that measure the construct. The response categories (options) for each scale item can be five, seven or any suitable number. As stated earlier, the scale items should be mixture of positively and negatively worded statements. The scale items of table 16.31 are typical examples of scale items compile to measure the attitude of Nigerians toward Technical education. As stated earlier, a beginning researcher may ask: how may scale items constitute a scale for measuring a construct? The number of scale items depends among other things in the scope of the study. Suffice it to say, whatever the case may be a researcher should be guided with the fact that too many scale items about a construct in a questionnaire lead to either non-return or bias in selecting responses.
Administration of the compiled items to a random sample of respondents
Random sample of respondents from the target population who are not selected for the research are asked to select a response category that is the most closely reflect their view for each scale item.
Determination of Discriminative power of items
one of the goodness of an attitude scale item is to distinguish people who are high on the attitude continuum from those people who are low. In fact, the ability of a scale item to discriminate those who are high on the attitude continuum from those who: are low is termed as its Discriminative Power (DP). Scale items with high values of DPs are retained while those with very low values are dropped.
To calculate the DP of a scale item, the researcher place the scores of all respondents in an array from lowest to the highest and then select the upper and lower quartiles. Upper quartiles (Q1) constitute a group of respondents that made top 25% while lower quartile (Q3) group represents those respondents that made bottom 25%. We then add the response of each group and divide by the number of the respondents in the group. The difference between the two values obtained gives the discriminative power of the item.
Let use the hypothetical data collected from 1o respondents in scale shown ' below (table 16.51) to demonstrate calculation of discriminative power of a scale item. From the scale, we place all the scores of the ten respondents in the first item in an array, from the lowest to the highest as follows;
5,5,4,3,2,2,2,2,1
The total score = 5 + 5 + 4 + 3 + 2 + 2 + 2 + 2 + 1 = 26
From the scores, 5, 5, and 4 make the top 25% (i.e 14/28 x 1oo = 5o.o%).
Similarly, 2,2 and 1 make the bottom 25% (i.e., 5/28 x 1oo = 17.9%)
The total score in top (Q,) = 5 + 5 + 4 = 14
We divide this score by the number of respondents in the group i.e
14/3 = 4.67
Similarly, the total score in bottom 25% (Q3) = 2 + 2 + 1 = 5
Dividing this number by 3 gave 1.67
DP = 4.67 1.67 = 3.oo
The high value of Discriminative Power (or Index), 3.oo shows that item one in the scale is a good discriminator. Therefore, the item should be retained. Table 16.52 summarizes the calculation of the DP of the first item. Table 16.53 shows the table for the computation of DP of the second item in scale below (table 16.51). A value of o.33 indicated that the second scale item is a poor discriminator. This is because almost all the respondents checked the same response category (strongly agree). Therefore, the scale item should be dropped.
Another approach to DP is to use the measure of Internal constancy (see chapter 23).
Table 16,51Likerl scale representing the responses of 1o respondents on the attitude of Nigerian toward Technical education.

R1 = first respondent \\sqrt = checked \\sqrt R1 = option checked by first respondent SR1 = Score of first respondent
Table 16.52 Table for the compilation of DP of the first item

Where; weighted total = score x number who check that score
Weighted =

Table 16.53 Table for the compilation of DP of the second scale item

4.Selection of Scale items the scale items with high DP values are selected.
5.Test Reliability for testing reliability, we can use test-retest, split-half or Cronbach Alpha (see chapter 23).
16.6Application of Likert Scales
In section 16.31, we used a Likert scale to measure the attitude of a research participant towards technical education. To make such measurement more meaningful, we measure the attitude of two research participants on technical education. Table 16.61 shows a Likert scale that contains the hypothetical scores of two research participants as 18 and 17. From the result of the measurement, we can say that the first research participant has more favourable attitude toward technical education than the second one.
Table 16.61Likert scale for the measurement of attitude of two research participants toward technical education

√ = check for first respondent
x = Check for second respondent
The questionnaire we use for social surveys incorporates Likert scales (see chapter 17).
16.7Controversies over the Construction and the use of Likert Scales
Frankly speaking, Likert scale is the most widely used measuring instrument among social scientists and at the same time, the most controversial scale. In this section we shall look at three areas where researchers differ on what a Likert scale should be and how to interpret results from the scale. The areas are the number of response categories, classification of the scale and interpretation of result from the scale. The aim of this presentation is to enable a beginning researcher to be aware of the controversies surrounding the construction and the use of the scale. | reproduced different opinions concerning Likert scales so that a beginning researcher can make comparison before taking appropriate decision.
Number of response categories
Likert scale consists of series of positively and negatively declarative statements with response categories (options) for each statement. To find the actual number of response categories used by Rensis Likert, we make some references. Polite and Hungler (1995:281) stated that Likert used five categories of agreement-disagreement. They further stated that investigators prefer a seven-point scale, adding the alternatives “slightly agree” and “slightly disagree”. Smith (1988:58) described Likert scale as consisting of a series of positive and negative opinion statements concerning a construct, each accompanied by a five or seven-point response scale. From these two references, we can conclude that Rensis Likert used five-point response scale but researchers later added two response categories, perhaps to make measurement more accurate or reliable.
Any reader of research literature may find the possibility of the use of four or six-point Likert scale. For example;
Atypical Likert scale contains the following options:
Giles (2oo2) reported:

There are a number of variations on this type of response scale. Some scales use 7 options, others 4 or 6. one advantage of using even numbered sets is that respondents are forced to commit themselves to Either a positive or a negative position.
The use of four-point Likert scale means that the undecided category is not used. Therefore, the scale has the following categories “strongly agree”, “agree’ “disagree”, “strongly disagree”. The reason for removing the undecided category’s not far from the fact that how can one weigh or score no response or neutral category
3. To others undecided has a place in the scale, adding that respondents have the right to remain undecided on certain issues. Put it differently, respondent should not be forced to check options against their wish. But, one thing to remember is that even a Likert scale with undecided option is already a force choice scale. To avoid the problem of undecided category many researchers used four-point scale. For example, Imonike (1998) used a four-point scale in her study of measures of improvement of student’s performances in Home Economics in Senior Secondary Certificate Examination in oredo L. G.A of Edo State. The response categories she used were strongly agree, agree, disagree and strongly disagree and weighted as follows;
Strongly agree 4
Agree 3
Disagree 2
Strongly disagree 1
To retain the undecided category and at the same time weight it appropriately, Nworgu (1991:146) modified (proposal) Likert scale as follows;
U SD D A SA
o 1 2 3 4
With this kind of modification, he automatically converts the scale from interval scale to ratio scale. Some of the implications derivable from this kind of modified Likert scale are;
Is it possible to have absolute zero opinion, belief or attitude? Do we really have absolute zero opinion, belief or attitudes on issues?
Disagree opinions is two times stronger than strongly disagree opinion. Similarly, strongly agree opinion is four times strongly disagree opinion. on what basis do we reach such equalities? Furthermore, even the original scale used by Resins Likert may not be an interval scale (we shall see later), let alone modify it to be a ratio.
Polit and Hungler (1995:281) have something to say about undecided category.
There is also a diversity of opinion about the advisability of including an explicit category labeled “uncertain” (undecided). Some researchers argue that the inclusion of this option makes the task less objectionable to people who cannot make their minds or have strong feelings about an issue. others, however, feel that use of this undecided category encourages fence-sitting, or the tendency to not take sides. Investigators who do not give respondents an explicit alternative for indecision or uncertainty proceed in principle as though they were working with five- or seven-point scale, even though only four or six alternatives are given: non response to a given statement is scored as though the neutral response were there and had been chosen.
Use of Likert scale as Interval Scale
Interval scale should have at least two of the following properties.
The categories are rank ordered
The distances between two adjacent categories are equal.
A thermometer graduated in degree Celsius (“C) is an example of an interval scale, it is an interval scale because its categories (25”C, 26”C, 27”C, etc.) are rank ordered. Furthermore, the distance between the two adjacent categories (i.e 26- 25 = 27- 26 = 28 27 = 1°C) is constant. Certainly, the above analysis will enable us to classify Likert scale as ordinal or interval scale. First, we consider the response categories of a Likert scale.
Strongly agree
Agree
Undecided
Disagree
Strongly disagree
One of the conditions to be satisfied by a Likert scale before becoming an interval scale is for the distance between the response (options) categories to be the same, that is, the distance between strongly agree and agree the same as the distance between disagree and strongly disagree.
Nachimas and Nachimas (2oo4:258) reported;
The numerical codes that accompanied these categories are usually interpreted to represent the intensity of the response categories so that the higher the number, the more intense the response. Although we assume that the quantifiers (response categories) involved are ordered by intensity, this does not imply that the distance between the categories is equal. Indeed, rating scales such as these are most often measured on ordinal levels, which only describe whether one level is higher or lower than another level but do not indicate how much higher or lower.
Furthermore, Smith (1998:6o) stated “Likert scales are usually treated as interval measure, although Likert himself originally assumed that they achieved only an ordinal level. The assumption of equal distances between response options should be re-examined each time the researcher employs Likert scales
In his contribution to the debate on likert scale as an interval scale, Achyar (2oo8) explained:
The popularity of likert scale is not without controversy. Whether it is an ordinal or interval is a subject of much debate. Although Rensis likert himself assumed it has an interval scale quality, as it was originally, intended as a summated scale, some considered likert scale is ordinal in nature (Elene and Seaman, 2oo7), and treating it as internal or even ratio, is unclear, if not doubtful (Hodge and Gilliespine, 2oo3); summing ordinal data will not make it interval, only summated ordinal data. Because of the ordinal nature, Elene and Seaman (1997) stated that likert scale is most suitable being analyzed by non-parametric procedure such as frequencies, tabulating chi-squared statistics, Kruskall-Watlis.
Any reader of research literature know that Likert scales are widely used as interval scales. The fundamental question is, do we continue to use Likert scales as interval scale or restrict its use as ordinal scale?
Interpretation of results from Likert Scales
Kalu (2oo2) conducted research on the implementation of continuous assessment in technical courses in Lagos state technical colleges. He used four-point Likert scale and treated the scale as interval scale. In taking decision, he considered a mean of 2.5 and above as successful implementation of continuous assessment in technical courses in technical colleges in Lagos state. on the other hand any mean less than 2.5 was regarded as unsuccessful implementation. Does it mean that a mean of 2.45 rationally represent unsuccessful implementation of continuous assessment?
Note that the researcher use interval scale, generated interval data and interpret the result on nominal scale (i.e., successful or unsuccessful implementation). It is better to use the following interpretation.

Conclusion
Some researchers are with the view that people should not distort Likert scale, adding that whoever is not satisfy with the scale should find another one. Imagine our present aviation industry if Engineers refuse to modify the first aircraft built by Wright brothers. Will there be present sophisticated aeroplanes? Scientific research makes progress if people are allowed to modify the existing scales to suit their peculiar needs. It is with this conviction that I suggest the continuous use of four and six-point scales alongside with five, seven or nine point Likert scales depending on the condition at hand. Furthermore, Likert scale should be treated as interval scale.
Review Question
1a What is a Likert scale?
b Give three examples of a Likertscale.
2. Design a five point six-item Likert scale to measure self-esteem
a Administer the designed scale to 1o respondents and measure the self- esteem of each respondent, b Calculate the discriminative power of all the scale items,
c Decide on the items to be retained and dropped.
References
Giles, D.C. (2oo2). Advanced Research Methods in Psychology. New York: Routledge.
Imonikebe, B. (1998). Measures for Improving Students Performance in Home Economics in Senior Secondary Certificate Examination in oredo LGA of Edo State. Nigerian Journal of Curriculum Studies. Vol 1, No. VII, p. 153–161.
Alu, O. A. (2oo2). The Implementation of Continuous Assessment in Technical Courses in Lagos State Technical Colleges. Unpublished Med thesis. University of Nigeria, Nsukka.
Nachmias, F. and Nachmias, D. (2oo4). Research Methods in Social Sciences. London: Arnold.
Nworgu, B. G. (1991). Educational Research: Basic Tools and Methodology. Ibadan: Wisdom Publishers.
Polit, F. and Hungler, P. (1995). Nursing research: Principle and Methods. Pennsylvania: J. B. Lippincott.
Smith, M. J. (1988). Contemporary Communication Research Methods. Belmont: Wadsworth Publishing Company.

The correlation co-efficient(r) I given by

The computed value of the correlation co-efficient (or stability co-efficient) was found to be +o.98. This high value indicated that the students that did well in the first test also did well in the second test. Similarly, those students that perform moderately in the first test perform moderately in the second test. Therefore, the test is highly stable and therefore reliable.
A researcher who obtained a reliability co-efficient of + o.98 or little below that (say + o.7o) after test retest can go ahead and use his or her test for data collection. But what of a situation where a researcher obtained a co-efficient of reliability of say o.4o? Such a value indicates that the instrument is not stable or reliable. At this point the reader may ask, what make a measuring instrument unreliable? The unreliability of a measuring instrument can be from the poor construction of the instrument’ carelessness of the measurer or the nature of the variable to be measured. Sometime from the nature of the physical condition surrounding the variable. A poorly constructed measuring instrument may contain wrongly worded questions °r ambiguous questions. An ambiguous question for example, can make a respond to respondents to the same question at two different occasions differently (through questioning), thereby making the instrument unreliable. A solution to this problem is to correct the questions that seem to be either wrongly worded or ambiguous. Certainly, such correction will lead to a higher value of reliability co-efficient. Variation in scoring method can also be a source of unreliability of a measuring instrument. A measurer that uses two different scoring methods in test Retest is likely to have a low value of reliability co-efficient.
Poor construction of measuring instrument and variation in scoring method are not the only reasons for unreliability of measuring instruments. Variation of respondent’s attitude, behaviour, mood, and physical condition between two tests can also make an instrument unreliable. It is possible fora respondent to develop a headache, anxiety or to be mentally disorganized before the administration of the test and become okay before the administration of Retest. This situation will definitely render the instrument unreliable. What of the additional knowledge gained after the first test?
Another factor responsible for making an instrument unreliable is the memory interference. If the time between the test and Retest is made short because of the fear of intervening factors there is the possibility of the students to remember the question asked in the first test. A situation that makes the instrument unreliable. This will give higher value of reliability co-efficient.
From the foregoing discussions, we see that the co-efficient of reliability using test Retest technique is time dependent. Time dependent in the sense that short term retest tend to give higher reliability co-efficient while long- term retest give low reliability co-efficient. This implies that test Retest technique is only suitable in the measurement of attributes that do not change within short time. These include; personality, abilities and height among others.
Internal Consistency
The scales for the measurement of concepts or variables usually consist of multiple items. Each of these items is expected to measure the same concept. If the answers or responses to these items are highly associated with one another, the scale or instrument is said to be internally consistent or homogeneous. Three of the most widely used techniques in estimating the internal consistency of instrument will be discussed here.
Split half technique
In this technique, the items in a scale are splited into two groups by flipping of a coin, using odd and even numbers or other random assignment methods. A scale with 2o items can be splited into two groups. If we use odd and even numbers, the two groups will be; 1, 3, 5, 7, 9,11,13,15,17,19 and 2,4, 6,8,1o,12,14,16,18,2o. Each group forms 1o test items. The two tests are administered and the scores are then correlated. A high value of correlation co-efficient indicates that the instrument is internally consistent and therefore reliable.
It is clear that the correlation co-efficient to be computed using split half technique will not represent the entire scale. It represents only 1o item instrument. A situation that underestimate the entire correlation co-efficient of the 2o item test. To estimate the correlation co-efficient of the entire 2o item test we use Spearman Brown prophecy formula.

Where r = the correlation co-efficient computed on the split half r1 = the estimated reliability of the entire test.
If the computed correlation co-efficient for the split half test is o.7, then the estimated reliability for the entire 2o item that will be

We can now see that split half technique has two advantages over the test Retest technique. These advantages are;
The co-efficient of reliability is not affected with time.
It is less expensive than test-retest (i.e use only one test)
However, split half technique is not without problem. The method of splitting test items into two group can give rise to different reliability co-efficient (correlation co-efficient) for the same test. For example, using odd and even method or flipping of a coin on the same test can give different values of reliability co-efficient. Kuder Richardson formula 2o and 21 and Alpha (cronbach alpha) can solve the problem suffered by half split formula
Kuder-Richardson formula 2o
The Kuder - Richardson formula 2o is given by

Where r^ = Estimated Reliability co-efficient
K = number of items in the test
I = summation of
P = the proportion of the test takers who scored items correctly
q = the proportion of test takes who score items wrongly
S2 = variance of the test
Worked example 23.21
Suppose in an attempt to establish the reliability of a measuring instrument (achievement test), a researcher randomly selected 1o subjects and administered the following lost to them.
Atriangle has
A. Two angles B. Five angles C. Three angles D. Four angles
Asquare has
A. Two angles B. Three angles C. Four angles D. Five angles
A Box has
A. Two sides B. Three sides C. Four sides D. Six sides
The total angles of any triangle add up to A. 3o° B. 9o” C. 1oo° D. 18o°
The total angles of a square add up to A. 36o° B. 9o° C. 18o° D. 5o°
Suppose further that after scoring the subjects, the researcher came up with the following results.

Find out whether the research’s test is reliable
Solution
Calculation of ∑ pq
From the first table, the proportion of subjects that answered question 1 correctly
(P1) = ⁸∕₁₀ = o.8
The proportion of subjects that answered the same question wrongly
(q1) = ²∕₁₀= o.2
Note that we can also get o.2 by subtracting o.8 from 1 (ie 1- o.8 = o.2)
Using the same procedure,P2—o.9q2 = o.1
P2—o.8q2 = o.2
P2—o.7q2 = o.3
P2—o.6q2 = o.4
P1 q1 = o.8 x o.2 = o.16
P2 q2 = o.9 x o.1 = o.o9
P3 q3 = o.8 x o.2 = o.16
P4 q4 = o.7 x o.3 = o.21
P5 q5 = o.6 x o.4 = o.24
∑ pq = o.86oo
Calculation of S2
Using equation 23.21

A closer look at this formula will show you that is it simpler than kuder Richardson formula 2o in that computation of ∑pq is eliminated.
Cronbach Alpha
Conbach alpha (α) is a statistic commonly used by researchers as a measure of internal consistency of tests or scales. The statistic was developed by Lee Cronbach in 1951, who named it as alpha. Hence, the name Cronbach Alpha. Cronbach’s (a) is given by

Where K = The total number of items in a test or scale
S21 = The variance of each individual item
S22 = The variance of total test or scale scores
The Cronbach’s estimate reliability can also be based on item correlation. The formula for Cronbach reliability estimate based on item correlation according to Hayes (2oo8) is given by

Where Xji and Xij are elements in covariance or correlation matrix. K is the number of items in a given dimension of a construct. The numerator \\Sigma Xjiindicates that the elements in the diagonal of the covariance or correlation matrix are added together. The denominator \\Sigma Xji+\\Sigma Xij indicates that all the elements in covariance or correlation matrix are added together.
It is important for a reader without sound knowledge on matrix to visit section 32.6 of chapter 32 before proceeding to the application of equation 23.34.
We have already seen in chapter 16 that the calculation of reliability of a questionnaire or scale is one of the phases of questionnaire or scale development. Suppose a researcher wants to develop a questionnaire to measure customer service satisfaction, Customer service satisfaction has three dimensions: satisfaction with availability of service, satisfaction with responsiveness of service and satisfaction with the professionalism of service. Suppose further that the researcher is to measure customer’s satisfaction with the availability of service and consequently generate three items shown in table 23.21. To find the reliability of the questionnaire, the researcher has to administer the questionnaire to randomly selected subjects with the same characteristics with the subjects to be used in his study.
Table 23.21: Questionnaire to measure satisfaction with the availability of Service

Adopted from Hayes (2oo8)
Suppose Fig. 23.22 represents the correlation matrix computed from the data obtained from the administration of the questionnaire in Table 23.22 to subjects

Fig. 23.22: Corelation matrix
We can fined the estimate of the reliablity of the questionnaire using equation 23.24

With this value we can conclude that the questionnaire is reliable.
Remark
We have beenable tocalculate the Cronbach alphamanually simply because we dealt with only three variables. However in real questionnaire construction we normally use many variables (Items). In such a case computation of Cronbach alpha cannot be efficiently done manually. We use computer packages.
Internal Consistency, Dimensionality and Factor Analysis
In the last worked example we computed the Cronbach alpha and found it to be o.94 and concluded that the questionnaire is highly internally consistent and thus reliable. It is reliable in the sense that the value of Cronbach alpha is very high. What of a situation where the Cronbach alpha is small say o.42? An alpha value of o.42 renders the questionnaire unreliable. There are several factors that make a scale or questionnaire unreliable. These include the use of items that are ambiguous or not specific. To achieve higher reliability, one has to modify such items so that they become unambiguous and specific. Another reason that can lower the value of cronbach alpha’ is the presence of items in a scale that measures different dimensions of a concept. To achieve higher value of cronbach alpha, one has to conduct factor analysis (see chapter 32). The result of the analysis will put all the items that measure each particular dimension of a construct together. By this way the scale will have high internal consistency or high value of cronbach alpha, which in turn make it highly reliable.
Equivalence
In collecting data using observation technique, researchers often use two or more observers to rate some people, events, or places. In this case two or more observers using the same instrument to rate the same phenomenon are expected to have similar ratings. If the ratings are similar, the researcher concludes that such instrument is reliable. This kind of reliability is known as Inter observer (Interrater) reliability.
Interrater reliability can be estimated by the use of equivalence co-efficient. To find the equivalence co-efficient, two or more trained observers watch some people characteristics simultaneously and independently and record such Ql”i3P3Ctei’jstics. The characteristics recorded are then correlated to find the correlation co-efficient which is the equivalence co-efficient. A high correlation coefficient signifies that such observational instrument is reliable.
Another way of using the co-efficient of equivalence is in finding the reliability of a multiple choice test. In this case, the researcher construct a multiple choice test and then reversed the order of the responses choice or modify the question wording in minor ways to produce another multiple choice test. The researcher then administers the two tests to same-sample in a quick succession. Finally, the researcher correlate the two scores and find the equivalence co-efficient. A high value of correlation co-efficient show that the test is reliable.
The concept of equivalent is also used in finding the reliability of scales or questionnaires. To find the reliability of a questionnaire for example, a researcher has to generate large set of items that address the same concept or construct and then divide the items (either using random numbers or using even and odd numbers) into two sets. The researcher finally administers the two sets (parallel forms or equivalent forms) to the same sample. The correlation between the two parallel forms is the estimate of the reliability of the scale or questionnaire.
The Cronbach alpha based on parallel form test according to Brown (2oo1) is given by


Adopted from William (2oo6) and modified
(Note that the actual scale did not contain undecided category, I only included it for the sake of clarity).
Suppose further that the table below represents the responses of twenty (2) respondents to the above scale.


We can calculate the reliability of the scale by using equation 23.25. To do so you find:
The total score for odd numbered items of each respondent and put it in column o of the table below.
The total score for even numbered items of each respondent and put it in column E of the table below.
The total score for even numbered items and odd numbered items of each respondent and put it in column T in the table below.
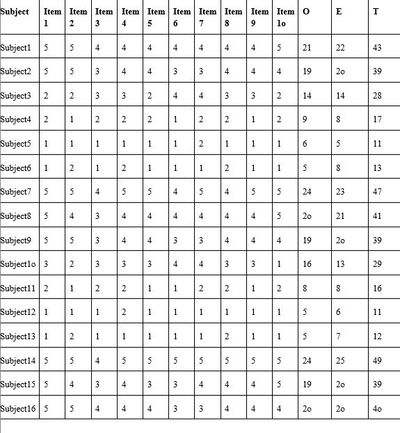
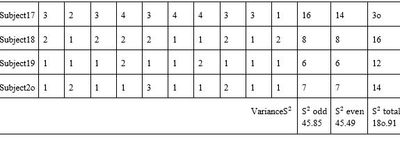


Interpretation of Co-efficient of Reliability
In our previous discussions, we have been talking about the values of corre ation co-efficient. We often say that a high value of correlation co-efficient indicate that the measure or test is reliable. What are the range of values of correlation co-efficient should be consider enough to make a measuring instrument reliable? There is no standard for what an acceptable reliability co-efficient should be. If a researcher is only interested in making group level comparisms, then coefficients in the vicinity of o.7o or even o.6o would probably be sufficient. By group level comparism, we mean that the investigator is interested in comparing the scores of such group as male versus female, smokers versus nonsmokers, experimental versus control and so forth. However, if measures were to be used as a basis for making decisions about individuals, then the reliability co-efficient should be o.9 or better (Polit and Hungler,1995)
23.3 Validity of Measuring Instruments
Quantitative research involves measurement of concepts or indicators of concepts. once the selected concept or indicator is chosen, the next step is to design a measuring instrument to measure it. The designed instrument is supposed to measure what it supposes to measure. The degree or extent to which a measuring instrument measure what it supposed to measure is what is referred to as its validity
To natural scientists the issue of validity is not of much concern. once they decide on the concept or variable to measure the next thing is to use a standard measuring instrument and measure the variable. For example, when a natural scientist wants to measure time, he use stop clock (or stop watch). To measure weight, he uses spring balance. These two measurements are valid with the two instruments However, achievement of valid measurement in social sciences may not be as easy as that of natural sciences (physical sciences). A social scientist may set out to measure one concept and ended of measuring another one. For example he may set out to measure anxiety and ended of measuring depression. Therefore, social Scientist and Educators pay more attention in finding out whether the concept they want to measure is really measured. They do so through four different approaches. These approaches are face validity, content validity, and criterion validity and construct validity.
Face Validity
A measure is said to have a face validity if the items in that measure are related to the phenomenon to be measured. In order words, face validity concerns with the extent to which the measurer believes that the instrument is appropriate in measuring the phenomenon. For example, a questionnaire with a question item that ask the number of houses acquired by a public political office holder within a year in office has a face validity if such questionnaire is designed to measure corruption. A report of high number of houses by the respondent indicates how corrupt he is. on the other hand a questionnaire with a question about the number of civil servant friends made by a public political office holder within one year in office is not likely to have a face validity if it is to measure corruption. The face validity of a measure is established after specialists agree that the items in a measuring instrument are related to the variable to be measured.
Content Validity
Content validity is concerned with sampling adequacy of the content that is being measured. The items in a measure should be representative in type and proportion of the content area. For example, when a teacher taught 1o topics in mathematics, his test questions should represent all the 1o topics. Furthermore, large topics should have more questions than smaller topics. A test with this kind of properties is said to have content validity. When items in a test are representative both in types and proportion of the content area, such a test is said to have high content validity. A test in the hand with some test items that cover topics not taught in the course, ignore or overemphasize certain topics has low validity. one of the practical ways of evaluating the content validity of a test is to systematically compare the test items with a given course content or syllabus or any other reference material.
Criterion Validity
Face validity concerns strictly about whether the measure is related to the phenomenon under investigation. It does not concern about whether the result obtained through an instrument is accurate or not. It is possible for an instrument to have face validity but measure variable inaccurately. For example, a question about the number of bottles of beer one drink in a week has face validity on the measure if ones alcoholic consumption, but may not measure the actual number of the bottles of beer drank by respondent. This is because many heavy drinkers tend to under report the number of bottle of beer drunken on self-report (eg) prequestionnaire minimizing such bias, scientist’s device a means of establishing the validity of self-report and other measuring instrument through the concept of criterion validity. Criterion validity is establish when the scores obtained on one measure can be accurately compare to those obtained with a more direct or already validated measure of the some phenomenon can be validated comparing such measure with that of urine test (criterion).
The criterion validity of a measure can be established in two ways. The first way is to measure the criterion at the same time with the variable to be validated. If e scores of both variables are the same or very closed, the measure is said to have a concurrent validity. The second way of establishing criterion validity is to measure the criterion after the measurement of the variable to be validated. Again, if the two scores are the same or very close, we say that the measure has predictive validity.
Educational measures are also subjected to criterion validity test. For example, a class room teacher may want to find out whether the test given to his students can predict the success or in a future test. If such test predicts either success or failure in future test, such a test is said to have predictive validity. To determine the predictive validity of a test, the teacher has to correlate the scores of the first test with that of the future one (criterion). If there exist a high correlation co-efficient, we conclude that the first test has predictive validity. Sometimes, a teacher may be interested in establishing the concurrent validity of his test. In this case he has administered two test in quick succession to his students and then correlate the scores of the two tests. A high value of correlation co-efficient show that his test has concurrent validity
Construct Validity
Before now we have been talking about validating measuring instrument that measure variables directly. There certain situations in which we have to measure a variable indirectly (through an indicator). If we do so, how are we sure that our Tmoment measure the construct under consideration accurately. one way of verifying this is to examine whether a proposition or theory that is assume to exist is confirmed with the measure from the instrument. Suppose that a researcher developing a new indicator to measure self-esteem. Suppose further that there is a positive relationship between self-esteem and health status. His instrument for measuring self-esteem is said to have construct validity of the measure obtained confirmed the positive relationship between self-esteem and health status.
Review Questions
1 (a) What is meant by the term Reliability of a measuring instrument?
(b) Under what condition a measuring instrument is said to be
(i) Reliable
(ii) Unreliable
2. Describe how you can use test Retest method to determine the co-efficient of reliability of a test.
3.(a) Mention three factors that can cause unreliability of a measuring instrument, (b) Explain any two of them.
4(a) Describe how you can use split half method to measure the reliability coefficient of a measure.
(b) State two advantages of split half method over test Retest method.
5. Under what condition a test is said to have internal consistency?
6(a) Write down the Cronbach’s alpha formula and define all the terms in the formula.
(b) Give one advantage of Cronbach’s alpha formula over split half method.
7. Write short notes on the following types of validity
(i) Face validity
(ii). Content validity
(iii). Criterion validity
(iv) Construct validity
8(a) What do you understand by the term validity of a measuring instrument?
(b) Distinguish between predictive and concurrent validity.
Shutt, R. K. (2oo4) Investigating the social world, California: sage publications.