CHAPTER THREE
3.1Types of Research Designs
Introduction
We had already indicated that there are some conditionalities that must be met for one to correctly, as it were, apply parametric or? non-parametric statistical tool in the treatment of his data. For instance, the design used in a study will guide the type of statistics to be used. We shall now discuss the different types of designs in this chapter and the appropriate design to use vis-a-vis the appropriate statistical tools to be used in the treatment of data obtained in the particular research design that was used.
Research design can be defined as the proposed or adopted systematic. and scientific plan, blueprint, road map of an investigation, detailing the structure and strategy that will guide the activities of the investigation, conceived and executed in such a way as to obtain relevant and appropriate data for answering pertinent research questions and testing hypotheses. The five major j components or issues which the research design deals with include identifying research subjects, indication of whether there will be the grouping of subjects; what the research purposes and conditions will be, the method of data analysis; and interpretation techniques for answering research questions and or testing hypotheses. So, these are some of the basic purposes of research design, which the researcher should take cognizance of or think through in determining the appropriate design to use. one of the basic considerations’ that will inform the choice of a particular design one should use is the purpose of the study. For example, if a study is intended for establishing causation or cause-effect relationship between an independent and dependent variable, the appropriate design is experimental. If a study is designed to find and describe, explain or report events in their natural settings, as they are, based on sample, data it is a survey. on the other hand, if a study intended to identify the level to which one ‘variable predicts ascend Related viewable such a design is, correlational. Sadie that seek to provide data for mating value judgments about some events, objects, methods, materials, etc. are evaluation design studies. Broadly speaking, all educational and social science research studies can be classified into the following two descripted designs which the researcher normally would adopt in conducting this study: descriptive and experimental design. Within descriptive design are surveys, case studies, etc.. Within experimental design are true and quasi experimental designs which can be broken down further, as we shall see later, when we discuss experimental design studies.
So far, we noted that the design of the study is a blue print or plan of work for a research study and generally it involves the researcher carefully, and systematically putting into consideration some thoughts on each of the five basic and common components of the typical research design indicated above, in this section. As we noted earlier, to make a choice of a particular, design, the researcher must consider what his study is all about with regard, to what he wants to accomplish as part of his study, how many subjects would. be involved, bold they be grouped and what would each group or sample do; what would be the specific and general activities that would constitute the research conditions, and would he be able to ensure subjects’ compliance to these conditions, etc.. what would be the data of the study and what tools can be most appropriately and effectively used in analyzing such data as well as the kind of accurate interpretation that can be made from the data analyzed. After such consideration, he must then reach a decision on earl of them in. terms of whether what is called for in the design to be used is feasible, logical and sensible. This latter issue unfolds when the research is in progress; if things do not go as well as was planned in the design, each of these components can be revisit in based on the reality on the ground. Modification modified due consultation and agreement with your alter made after researcher is fully satisfied and convinced tint rancour after the interest of the aims and objectives Chapter 3 of your thesis titled Research Methodology or Methods’1 under the section design, ensure that you indicate the design of your study by name, describe it and justify its appropriateness for use in the study, include information on how it was used in the study and •so on. You may even need to cite studies similar to yours where the design you selected was successfully used and reported, assuming you used a design that is complex and not familiar to many others.
Types of Research Design
With regard to the normal research process, one can identify two broad types of research designs, experimental (parametric) and descriptive (non-parametric) designs. All studies in education and social science are either descriptive or experimental or in a number of rare cases a combination of both; an aspect of a study can involve mere description of observed events while the latter part of the same study involves testing^ hypothesis under treatment and control research conditions. But in its strictest sense, as noted earlier, all research studies can be classified as falling into descriptive design o. experimental design. Within each of these two broad categories, are sub-categories of research designs, identified under either of the two broad categories, already mentioned.
Descriptive design studies are mainly concerned with describe events as they are, without any manipulation of which caused the even or what is begin observed any study which seeks merely to fled out what is and described it is descriptive case study surely historical research Gallup poll, instrumentation study causal-cooperative studies market research, correlation research evaluation research as well as tracer studies can be categorized as descriptive. For instance, a study in which a researcher develops and validates a test instrument as its major focus based on a certain curriculum, is instrumentation or developmental design. A study in which the researcher is interested in finding out the attitude of school administrators or teachers or union leaders toward free secondary school education, is a survey. For each of the two examples cited above and other descriptive studies like them, researchers are mainly concerned with investigating, documenting, and describing events. When a new procedure, method, tool, etc.. is developed and tried out as a major focus of a study, it is a descriptive study, referred to as instrumentation or developmental design study. Note that the new procedure, method, test, is used to obtain certain relevant information existing or absent (for example, achievements) without the developed procedure, method or test itself causing any observed changes in students’ level of achievements. Similarly, an instrument developed and administered to school administrators on their attitudes toward a proposed free tuition fee for secondary education is a survey because it does not cause or influence their attitude’; the instrument is used merely to elicit information on this subject matter, which is then described. Thus, the thrust of the study here is not on instrument development (not an instrumentation design study) but on using a developed instrument for surveying a particular phenomenon, event, etc. which is then explained, described, documented, etc.. From the foregoing it ought to be apparent to you that most descriptive studies rely on observation technique for gathering information, which is then summarized (analyzed and described. Another type of descriptive design which is gaining research prominence is the case study. In this design, emphasis is given to a limited spread of scope of coverage^ rather than a wider spread; depth is emphasized. A study in which the incidence of sexual harassment at the University of Jiblik is undertaken is a case study. What are the major strengths and weaknesses of a case study? A study which investigates the history and development of a named phenomenon, over a period of is historical (for example, The Child Soldier activities in the Post-Colonial Bush Wars in Sudan). If a historical study is long-drawn out, say for about. 6–12 years, it now becomes a longitudinal study. Market research design is a study on how market forces influence cost of goods and services, productivity, buying preferences, mobility of capital, acquisitions and mergers, etc.. Evaluation studies document the status of events and passes value judgments on those events. Casual comparative studies describe how an event that is not manipulated has probable impact on another event, e.g., a study on the impact which students’ head size has on achievement in mathematics. The major weakness of casual-comparative studies, also called Ex Post Facto studies is that they may lead to wrong conclusions commonly referred to as Post Hoc Fallacy. If in the present example it was: found that students with large heads achieved better in mathematics, what does this really mean? Rubbish. Why?
While descriptive studies have been known to be very useful as a basis for collecting and documenting information for institutional policy formulation or systems-wide improvement and management decision support system, they have been recently criticized for a number of reasons. Most of the reasons are not inherently traceable to descriptive studies themselves as much as to the researchers. For instance, most researchers are not thoughtful and systematic in sloping and using reliable and valid data- gathering instruments for collecting observational or survey data. Even when this condition Is satisfied, there is also the problem of the inherent distortion of information based on data collected as a result of researchers’ over-reliance on questionnaire, interview and case study data which sign with, are most likely to be unstable than stable. for instance, describing the smoking habits of teenage Nigerians, using volunteer samples, at street corners, entertainment clubs, churches, mosques, etc. based on their response to questionnaire data should be taken with a grain of salt rather than being seen as sacrosanct; attitudes to events change and earlier attitudes described become distortions to what they are now. This explains why questionnaire data should not be considered overly rigorous or reliable. We shall discuss in more details the specific and the different kinds of descriptive designs later in this chapter.
Parametric or experimental research designs are those studies which are mainly concerned with -identifying cause-effect relationships between independent and dependent variables of a study. This type of design enables the researcher to test hypotheses upon which valid, reliable, duplicable and verifiable conclusions are premised. An experiment is a planned and systematic manipulation of certain events, procedures or objects, based on the scientific model, such that every event, procedure or object is given a fair and equal chance to prove itself. Such a proof is determined through the careful documentation of observed changes or outcomes, if any. Thus, in an experiment, every element is kept constant, except one whose effects’ the researcher is interested in. Thus, through experimental design, a rigorous and scientific approach to investigating a problem, is made possible. This design calls for establishing research conditions under which an experiment can take place before such a design is said to be experimental. For instance, the design may demand that subjects for the study are randomly drawn and grouped and or the research conditions of treatment and control be randomly assigned to subjects. Experimental design also requires that whatever variables are to be manipulated, such variables are quantifiably and clearly defined and distinct as well as rigorously complied with to avoid contamination: Also, whatever extraneous variables that can mitigate between the independent and dependent variables are identified early enough and such extraneous variables removed or severely minimized. How and what observations (testing, data collection, etc.) are to be made, when, why and by who, are indicated. The type of statistical analysis to be used in testing the hypotheses and reaching conclusions must be relevant and appropriate to the design, type of data and so on. These and other demands which we will discuss later, clearly make experimental studies rigorous.
A central need for experiment in education and social science is ensuring that proper experimental controls have been established and complied with. There are usually three levels of controls in any experiment. The first level of control in an experiment is that of ensuring that all the subjects, prior to the. commencement of an experimental study is homogeneous or equal or the same on the characteristics, which will ultimately become the dependent variable. If the subjects are different on the dependent variable, say achievement in mathematics, clearly, they are not homogeneous or equivalent, even before the experiment starts. Consequently, any difference in the posttest (post treatment test or test given at the end of an experiment) across groups of subjects, which were not homogeneous, abilities may be due to chance rather than as a result of the treatment versus control research conditions. To avoid this problem, subjects, or samples should be randomly drawn from a common population rather than their being selected. When subjects are selected, this leads to the composition of arbitrary and non-probability samples. Selection bias is a major threat to an experiment. Indeed, if research samples are selected, one can no longer consider the design for such a study as true experiment, rather the design now becomes a quasi-experiment. one other way of ensuring a homogeneous sample is through the pre-testing of jests to” obtain base-line data prior to the commencement to the pediment. Based on the base-line data, subjects are equally strutted to treatment or control condition. However, when sampled research subjects are pre-tested, the design is no longer a true experiment but a quasi-experiment design. Quasi- experimental design is less robust and is used when subjects are pre-tested and the randomization of subjects in a study is not feasible. It is a school-friendly type of design in that it can be used in schools without any disruption to the school’s class structure or timetable of academic events. This can be achieved by assigning treatment or control research conditions to selected intact classes, etc..
The second level of control in an experimental design study is the identification of the attributes of the independent and dependent variables and as well as subjects’ compliance with the manipulation and systematic observation of any changes arising from treatment condition. Note that in experiments the control condition is not manipulated but merely observed. From doing these observations, the data obtained are appropriately parametrically treated and used for testing formulated hypotheses,
The third level of experimental control involves the assurance that extraneous variables such as those enhancing or mitigating events or threats to the study are removed or minimized. There, are generally two broad categories of such threats - internal and external validity threats. These threats will be discussed extensively on their own merit later in this chapter. Meanwhile, despite these threats, you need to consider and -decide the specific type of experimental research design you will select and use for your experimental study? You will mostly probably know this for a fact after you have read the remaining part of this section. Because there are many forms of experimental designs, we will need to discuss some of the more important ones in terms of what each one of them involves. However, an extensive and complete discussion of all the currently existing 36 different forms of experimental design studies is not contemplated in this book; such a discussion is beyond the scope of this book. The avid reader, on this aspect, may wish to consult
Cochran and Cox (1983) and or Campbell and Stanley Indeed, Campbell aid Stanley described sixteen specific forms experimental design. We will discuss only four of the most common ones in discussing these forms of experimental design the following symbol will be used
K: represents the random sampling of subjects or the assignment of treatment research condition randomly to an experimental group and control to another group. Remember that when you select your samples, the design of the study is no longer a true experiment. This is why all true experimental samples should be randomly composed.
X: represents the treatment or experimental variable (independent variable) manipulated as part of the research condition for purposes of observing its effect on the dependent variable, if any. Treatment must be carefully and quantifiably described, since its impact, effect, etc. is the major thrust of the experiment. A general broad description of treatment is unacceptable. It must be presented in such a way that another person somewhere else and in another era can duplicate your defined treatment in an identical, proposed experimental research. At the end of an experiment, the analysed treatment data should be reported in line with the research questions and hypotheses both holistically and singly, on the issues raised in the study.
C: represents the control variable, or no treatment condition (placebo). Here, nothing is manipulated. This aspect of independent variable is left naturally to operate without manipulation so as to observe its effect or lack of effect on t dependent variable. Note that the control is the contrast to it treatment. No aspect of the control should be in the represents observation or test administered to subjects and which is a measure of subjects’ performance on the tentative variable. Any tools used for observation must be in me problem of the study, purpose of study, research questions and - hypotheses. Such observational tools must also be valid, reliable and useable. o and o mean pretest and posttest.
S: represents a line between levels and used to indicate equated groups or equivalent groups.
S: Represents the subject in an experimental study; the plural is Ss. E: Refers to ‘the experimental group subjects (i.e.,, the treatment subjects or those who receive X).
3.2True Experiment
In designs of true experiment, the equivalence “of the treatment (experimental) and control group subjects is attained by the random sampling and assignment of subjects to treatment and control conditions respectively. Where this is difficult to do, as in normal school settings where this is usually the case, two equivalent groups, say pupils of two streams of junior secondary three (by their being students in the same class, they may be technically considered to be academically equivalent or homogeneous) may be respectively randomly assigned to treatment or control conditions without the students themselves teeing randomly assigned to groups. The true experimental design calls for no pre-testing of subjects. We will now discuss two forms of true experimental design.
The post-test only equivalent groups design is very powerful and effective design in the sense that it minimizes, if not completely removes, internal and external validity threats to an experiment. Experimental and control groups are equated, on any of the ' research-related, pre-determined variables, through random sampling and grouping. Note that when samples are randomly drawn and grouped, they have a very high probability of being Homogeneous and representative of the populations they were drawn from.
Selection of samples in experiments introduces selection biases, and this is a very serious threat to the experiment, and findings of any study. In the above design, there is no pretest and the randomization process is part of the control to ensure that the selection bias, pretesting effects and contamination by all possible extraneous variables are removed which then assures that any initial differences between both groups, before the commencement of the research treatment conditions is very small and of no serious consequence to the observed outcome, at the end of the experiment. In this design, after subjects are assigned to groups (there can be as many groups as the researcher wants or as is required by the study but they must be made equivalent through randomization), the researcher has to decide which group will recipe treatment and which group will receive control. only the subjects in the treatment group will be exposed to the experimental treatment. The control group receives no treatment (or attributes of treatment) but in all other respects it is treated like the experimental treatment group. For instance, if the planned experimental treatment is teaching with laboratory method while the control is teaching with lecture, these conditions will Very clearly be defined in terms of their characteristics and how teachers will comply with them but more importantly these characteristics must prevail respectively to the two unique groups. The researcher must see to it that there is no mixing of any of the aspects of treatment condition with any of the aspects of the control condition. When this mixing occurs, this results in research condition referred to as subjects’ contamination. This is a very serious methodological shortcoming in research in education and social science or indeed • any research study. This notwithstanding, all other conditions of the experiment will be the same for both groups. The amount of time allotted for actual teaching, the teachers’ qualification and teacher personality, the topics taught, etc. will have to be the same for the experimental treatment group as well as the control group. At the end of the experiment, both groups arc given the same posttest which is a measure of their reaction or response to the dependent variable (achievement on a test, etc.). The mean post-test score of the experimental treatment group subjects is statistically compared with the mean post-test score of the control group subjects using an appropriate parametric statistics or tool. The underlying assumption is that if the means of the experimental treatment group is the same or very close with that of the control, then treatment is of no significance. Put differently, if the mean score of the experimental treatment group and the control group are statistically significantly different (and this difference is too large to be due to chance or to be explained to have arisen from chance factors) one can then assert that the experimental treatment conditions were responsible for the observed result; treatment caused the outcome of the observed differences between the experimental treatment and control group subjects. This design is strongly recommended for use in experimental research in education and social sciences because of its many in-built advantages one of which is the establishment of two homogeneous or equivalent research groups, as has already been highlighted. Also, this design ensures adequate controls for the main treatment effects to operate, thus effects of history is minimized or removed since there was no pre-testing, and little or no maturation since this is not a long drawn out design. For instance, because there is no pretest, there is no interaction effect between pre-test and west-test and no interaction between independent variable (teaching methods). This design is useful because of its rigorousness and flexibility in using it for studies where pre-testing is undesirable and will introduce internal validity threat. The design is used in studies where pre-testing is unnecessary, such as in studies involving early or entry level new intakes to a programme who may have no previous known level of knowledge or any knowledge at all to be pretested for. Note that this design can be extended to include more than two groups if necessary or needed. A major disadvantage of this design is that, while it establishes the differences in performances, achievements etc., at the end of the experiment, it does not allow the researcher the opportunity to observe any change when the study started but only when it ended; the reason for this being that there was no pretest which would have allowed for pre-experimental observation on the kinds of changes in the subjects that pre-existed and so on if any* within the same group of subjects or across different group of subjects. Some researchers have also observed that without pretest’s baseline data, it would be difficult to correctly assume that all the subjects in the study were homogeneous prior to the commencement of the study. They further correctly argue that randomization as we said earlier, can sometimes even if rarely, yield non-homogenous samples.
The second form of a true experiment which we will discuss is the Solomon Four Group Experimental Design. This design was established by Solomon (1964) in response to the need for finding an all-embracing and rigorous design which satisfied many of the demands by researchers seeking ways and means of removing maternal and external validity threats to their studies. The design is represented below 268 Conducting Research in Education and the Social Sciences
Solomon Four Group Experimental Design

The major and essential features of Solomon Four-Group Experimental design is that it employs an alternate to one aspect of each line of activities in the design or plan. For instance, Group 4 arrangement with regard to pre-testing is an alternate to Group 2; Group 3 arrangement is alternate to Group 2 as far as the research conditions of treatment and control are concerned. other features of this design is that it overcomes the interaction effect of pre-testing usually present in pre-test post-test design studies. Notice that subject in the experimental Group 3 are not pre-tested but they received treatment while subjects in Group 2 are pre-tested but did not receive treatment. The mean score difference between the pretest and post-test (the dependent variables) are used to determine the interaction between pre-testing and post-testing or the so-called transfer effect of pre-testing in the study. Also, notice that because pretest was administered in this design (to Groups l and 2) data from pretest can be compared with data from post-test, as Gain Scores, thus enabling the researcher to observe and determine the direction of change in the subjects. You may recall as we pointed out in the two previous paragraphs, post-test-only, equivalent ' group experimental design jacks this advantage since it does not include pre-testing. In Solomon Four-Group Experimental Design, the post-test means are used for analysis of variance calculation to determine how significantly different the subjects’ mean post-test scores are: a statistically significantly higher mean post-test score for treatment than control indicates that there is no basis for asserting that the inter-group difference was due to chance. The basis of your argument may well be that reactive effect of pre-testing did not in any way distort or mitigate the post-test data. So, by considering the’ post-test data from control group 3 that did not receive any pre-testing, any contrary argument then does not have a locus stand especially if the mean post-test value of control group –3~ is significantly higher than that of the control group 2. We can correctly assert that the experimental treatment caused the observed outcome (post-test) rather than the transfer effect of pre-testing and interaction between pretest and treatment being the cause of significantly higher achievement. Thus, control group 3 that has no pretest is acting as a balance or alternate to experimental treatment group 1 that had treatment and pre-test. By adding the control group 4, the design gains control over any possible contemporaneous effects that may occur between pretest and post-test. Seen at full glance, this design really involves conducting one experiment twice’,’ once with pre-testing to two groups and once without pre-testing to two other contrasted groups. The two pre-tested groups are contrasted between themselves as far as treatment and control conditions are concerned and the two post-tested groups are contrasted between themselves, as far as treatment is concerned. Then on their own, experimental I group 1; fully contrasts with- experimental group 3 while control group 4 fully contrasts with control group 2. The advantages of this design, in addition to that noted above, have been pointed out by Ali (1986, 1988, and 1989); this design minimizes internal and external validity threats to experimental research, to the barest minimum. But, by and large, the researcher must clearly and quantifiably define what his independent variable(s) are (experimental treatment and control) and how they will be manipulated and complied with during the study. For example, two levels of an independent variable may be guided discovery and use of a particular textbook A (treatment) and lecture/textbook B (control). The dependent variables may be students’ achievements, cognitive styles, and cognitive development in physics; a 2 x 3 factorial or Solomon Four Group Experimental Design Study.
There are two main disadvantages arising from using Solomon Four Group Experimental Design for an experimental study. The first disadvantage is that it is much more difficult to carry out the demands of this design in schools or in many practical situations. Clearly, Solomon Four-Group Experimental Design imposes more costs in terms of time, money, efforts and services than any other design because it is actually two experiments in one design. The second problem is with regard to the enormity of statistical analysis required by this design. There are four groups of subjects but six sets of data collected; given that for the four groups, there are only four sets of complete post-test data and for two groups there are two respective pre-test data. If all the groups had pretest, then there would have been eight sets of data for the groups but as you well know, this is not the case. Consequently, the complete set of data, the post-test is analyzed with analysis of variance statistics while the pretest to post-test data for two groups is analyzed with analysis of covariance for pre-test interaction effect on the post test. Doing these two tests separately is time consuming. So, statisticians have devised one test that can do both analyses simultaneously. The test that combines these two features - analysis of post-test data, and analysis of pre-test data (i.e.,, analysis of pretest-posttest covariates) is called the Analysis of Covariance, ANCoVA, when only one dependent and one independent variable arc involved. The application of this test, ANCoVA, and other parametric tests are long, demanding and rigorous, but some examples have been done for you in chapter 8.’ Because of the severe demands imposed on the researcher who wants to use the Solomon Four-Group Experimental Design, demands which an entry-level researcher may not be able to handle, it is advisable for him not to contemplate using this research design until he is adept and advanced in the techniques of experimental research; something that occurs much later in one’s experimental research experience.
When the variables investigated are numerous, such as in the 2(independent variables) x 3 (dependent variables) factorial or Solomon Four Group Experimental Design, an even more complex analysis called Multiple Analysis of Covariance (MANCoVA) is used for data treatment.
Single Group and Factorial Design: Quasi-Experimental Design
In a large number of real-life research situations, researchers find it difficult, if not impossible, to use true experimental design in carrying out studies. This may be because the scheduling and implementation of experimental treatment conditions or the randomization and grouping of subjects are not possible; in some cases, schools would not allow their programmes to be disrupted or for all their pupils to be used as research subjects. Under these circumstances, the researcher may have to fall back on only using designs which are not truly experimental and, which offer less well and less rigorous controls compared to the true experimental resign. Designs of experiments which offer such less well rigorous senses controls are quasi-experimental. To use these designs effectively well, the researcher should know their main points of strengths and fully take advantage of these while avoiding their weaknesses and pitfalls as much as he can. In other words, this involves knowing which variables have to be adequately controlled for, reducing the sources of internal and external validity threats and so on.
one type of quasi-experimental design is the Non-randomized. Control-Group, Pretest-Post-test-design. The design uses non-randomized groups and this option occurs when the researcher cannot randomly sample and assign his subjects to groups. Thus, he has to use groups already in existence such as groups already organized as intact classes, trade unions, town unions, as distinct co-operative society, women of common interest and of equal socio-economic status, (widows, etc.) members of the same social club, etc. Since the research subjects are not randomly sampled, ‘selection of subjects increases the researcher’s selection biases as, well as sampling error in terms of whether the selected subjects truly represent the population from which they were drawn and whether the subjects, when grouped, are homogeneous or equivalent. To minimize these problems, there is need for selecting subjects on such criteria which would ensure that homogeneity or equivalence of subjects in the different research groups proposed is achieved or seen to have been achieved, at the Beginning of the proposed study. Furthermore, a pretest should be administered at the beginning of the. proposed study and the pretest data can be used for finding out whether the subjects in the different groups are homogeneous (equivalent) or not. If subjects in one group score disparagingly higher than subjects in another group, in the pretest, through sorting and matching or rearrangement, it is possible to establish homogeneity (equivalence) of groups. For instance, this can be more \ - easily done by the researcher mixing high ability with low ability students equally well in all the groups so as to achieve some measure 6f equivalence or homogeneity of groups, before starting the actual research work. At the end of the study, using an analysis of covariance technique, the researcher is also able to compensate for the initial lack of equivalence between groups. Analysis’ of Covariance is a statistical technique which establishes equality of baseline pretest data, before the commencement of the study, and then establishes the covariates between the pretest and posttest, and ultimately determines whether there is any significant difference between groups based on the gain scores, i.e., difference between pretest, and post-test. Let’s look at a diagrammatic representation of the non-randomised control-group pretest-posttest design.
SamplingGroupingPretestingResearch
conditionsPost
testing
- (None)Expt. Gr 1oX i.e., Treatment o
- (None)Control Gr 2o- i.e., Control o
Given that it was not possible to randomly compose and group subjects, you may wish to consider, in the alternative, respectively assigning experiment and control conditions randomly any of the two groups. This can be done by flipping a coin, so as to decide which group is to be the experimental treatment and which group is to be the control group. As much as possible, subjects should not be informed ahead of time about what the research conditions are. Again, they should not be requested to volunteer for any particular group especially if they are aware of what each group will be involved in doing, during the research. When this happens, and subjects are aware of the research condition they will be exposed to, there is a tendency for them to react to this newness effect or awareness and consequently knowingly or unknowingly distort the -full effects which the treatment/control conditions (i.e the research conditions) is intended to have on the dependent variable (the outcome of the experiment). Even when we achieve this anonymity in disclosing research conditions to the subjects, there is yet another problem posed to this kind of design, i.e.,, in an experimental design in which subjects are selected, rather than sampled, and there is pre-testing and post-testing. This is the problem of regression.
Variable to determine their effects on the dependent variable Hypotheses are stated within the framework of a defined and acceptable related and relevant research problem. An appropriate experimental design is used for collecting data scientifically toward testing the stated hypothesis. Data obtained from an experiment are analysed and results used to accept or reject the hypothesis. Conclusions drawn on such sustained acceptances or rejections are then generalized to the entire population similar to the one the sample was drawn from so that the ultimate goals of an experiment are to predict events; control and expect certain events, build up on the body of knowledge and facts within a given area experimented upon, and discover new grounds to explore and exploit toward improving our lives on earth. Because the goals of experiments influence our lives very profoundly, a great deal of careful and important considerations constitute the framework or characteristics upon which the conduct, substance or bedrock of experiments are anchored. There are three essential characteristics of any experiment. These are control, manipulation, and observation characteristics; the so-called center piece of experiments. Read these carefully and understand them. They are important.
Control characteristic aspect of an experiment is concerned with arranging quantifiable and manipulate able research condition and such a way that their effects can be measurably investigated without control, it become impossible to determine the effect of an independent variable on the dependent variable; the control in an experiment are 1) given that two more situation are equal in every respect, except for a factor that is manipulated or added to or deleted from one of the two or more situation any deference appearing (as measured through testing) between the two or more situation is attributable to the factor that was manipulated or added or deleted from. This assumption is called the law of the Single Variable, developed by Mill (1873:2o). Indeed, Mill noted, a long time ago, that:
if an instance in which the phenomenon under investigation occurs, and an instance in which it does not occur have every circumstance in common save one, that one occurring only in the former, the circumstance in which alone the instances differ is, the effect, or the cause, or an indispensable part of the cause of the phenomenon.
The second assumption is that if two or more situations arc not equal but it can be demonstrated that none of the variables is significant in producing the phenomenon under investigation, or if significant variables arc made equal, any ‘difference occurring between the two situations, after the introduction of a new variable to one of the systems, can be attributed to the new variable.
This second assumption is referred to as Law of the only Significant Variable. of the two assumptions above, the second one is important in education and social science because it ‘is very unlikely that an outcome of a study (the dependent variable) or what we observe after manipulating the independent variable can be as a result of only one variable (acting alone without any other variable affecting or influencing the outcome, we observed). Usually, variables act in combination rarely singly, to produce an observed outcome. For instance, why is a political party more successful than others? What variables operated to ensure that a particular student scored highest in a particular mathematics achievement test administered to his class? Education and many social events deal with human beings who are constantly affected by many variables and what we observe about them, therefore, are consequences of many variables, not one Variable. Experiments in laboratories involving chemicals, temperature changes, etc. can be attributed to the law of the single variable but not in education and social science. Fortunately, in education, we can substantially minimize the effects of other variables so as to manipulate one variable, under rigorously controlled conditions, and then go on to determine its effects on the dependent variable. Within the assumption of the law of the only significant variable, other variables are operating along with the manipulated one but it is the case that these variables are controlled out or operate to a minimum, thus leaving the significant variable to dominate and exert its effects on the dependent variable. If a variable is known or suspected to be irrelevant and unlikely to operate in conjunction with a likely significant variable, such an irrelevant variable is ignored. Insignificant variables in academic achievement-related and social science studies include height; hair colour; weight; religion; tribe; shoe size; size of head, toe, hands etc.; dress preferences; musical preferences and so on. These should be uncontrolled for or simply ignored in experiments, in which, for instance, teachers’ personality and effectiveness of teaching methods, comparisons of two or more curricula or social programmes effectiveness are intended to be investigated. on the other hand, significant variables, which can influence experiments and need to be controlled for when one is carrying out experiments on subjects’ social traits, include their interests, study habits, socio-economic attainment, motivation, political affiliations, and reading ability. General intelligence, socio-economic status of parents, and others like these variables are significant variables. To reduce the effects of these kinds of undesired but significant variables, which may not be the main thrust of a study but which can affect the outcome of a study, the researcher must establish controls over them, so that their effects are minimized. The effects of these undesired but significant variables can be removed by ensuring that subjects in the research groups are equally matched on each of these undesired but significant variables before commencing with the experiments on the groups. otherwise, if for instance, subjects in group 1 are better readers than group 2 subjects, group 1 subjects have more interest than group 2 subjects, group 1 subjects have better motivation than group 2 subjects, any difference in achievements, between the two comparative groups, can be attributable not just only to the one independent variable of the experiment manipulated (such as teaching method, teacher personality/effectiveness etc.) but also to the other undesired but significant variables of reading ability, levels of interests and levels of motivation, respectively. As far as the three distinct examples are concerned, control therefore, indicates the researcher’s actions designed eliminate the influence of undesired but significant variables as well as elimination of the differential effects of undesired but significant variables upon the different groups of subjects participating in an experimental study in education and in the social science disciplines. When such controls have been achieved, the confounding, enhancing or mitigating effects of the undesired but significant variables are reduced or removed such that only one variable, the significant independent variable, is then deemed to have caused the observed outcome (dependent variable) of the experiment. There are five ways of controlling for the undesired but significant (pre-existing intervening) variables, which can enhance, confound, mitigate or mix up an observed outcome or effect of an experimental study; they are considered pre-existing because, in a sense, they existed in the subjects or the subjects had them prior to the commencement of the experiment. The five ways are through randomization of subjects, random assignment of subjects to respective groups using a sample-and-assign method to group subjects rather than sample and her then assign subjects to their respective groups; random assignment of treatment or control research conditions to research 8foups, respectively; use of covariance statistics if random sampling of the research groups cannot be achieved; use of covariance statistics if the research design involved pre-testing or if subjects were selected and then grouped for the experimental purposes; matching students and ensuring that they are all equally matched on each of the undesired but significant variables and then assigning them to their respective research groups.
Manipulation characteristic aspect of an experiment is concerned with the researcher’s actual and deliberate total and systematic compliance with all facets of the predetermined or planned events, conditions, procedures and actions which are imposed on the treatment group subjects as the experimental treatment; only treatment is manipulated while the control research condition or placebo is not manipulated. It is expected that in an experiment, the researcher must totally, rather than haphazardly comply with all aspects of the research conditions of experimental treatment (which is manipulated) as well as that of the control (events, conditions, etc. which are not manipulated). Technically, the experimental treatment condition is the hallmark or substance of the independent variable and it is the major thrust or condition that is manipulated for investigation of its effects on the dependent variable. Even when in an experimental research two or three conditions, event or actions constitute the independent variable (for example, for, a study on the Effects of discovery versus lectures on students Recall Abilities in Algebraic Tasks) discovery and lectures are the two research conditions that constitute the independent variable. The researcher may decide that discovery teaching method is the treatment condition. So, it is introduced and manipulated. Both are actively monitored and followed through for their effects on the dependent variable; in this example, discovery method of teaching is the experimental treatment condition, event or action and it is manipulated in line with the researcher complying with the five known characteristics of discovery teaching method, so as to determine its effects on student’s ability to recall algebra they were taught. The control research condition of the experiment, lecture teaching method, is not manipulated. Nonetheless, if an experiment involved two treatment conditions simultaneously (for example; the effects of warm and cold water with high quality and low-quality detergent on washing dirty clothes), both warm and cold-water conditions are simultaneously manipulated respectively using low- and high-quality detergent in washing dirty clothes to find out which one cleans the clothes better. Warm and cold water at one level, and the use of high quality as against the use of poor-quality detergent in both types of water (warm and cold) are independent variables. How well the clothes washed under these water and soap conditions are clean, is the dependent variable. The research data of their separate dual effects on the cleanliness of washed clothes can be determined by multivariate analysis, quantitatively using Multiple Analysis of Variance (assuming that waters of varied temperatures are assigned quantitative values and used to wash similar levels of dirty clothes whose cleanliness levels are determined, and after the washing, the cleanliness of clothes are assigned quantitative values, these quantities are then statistically compared).
Finally, proper and accurate observation characteristic aspect of an experimental design study partly concerns the researcher’s carefulness in determining exactly those attributes or outcomes in a study which have to be measured and recorded. Ideally, such attributes or outcomes to be measured should be quantitative dependent variables. observation, in its most direct operation in the school setting, involves testing and accurately recording students’ achievements. These require that the researcher develops and uses tests that are fair to the taste and valid and reliable for measuring | subject-matter or constructs the tests were supposed to measure. t also requires that we grade and score achievements in fair an accurate manner, using a valid and reliable marking scheme only when we do these that achievement as an index of observation of learning in schools can lend itself to a high level of predictability of learning as well as explanations of how learning occurs. When this is done, quantitative data of experiments will enable us have a better understanding of these independent variables that cause learning to occur, how successful social and economic programmes are and so on. obviously/ we cannot, as you probably know, measure learning per se but we can attach a fixed quantity at a time, place and on a given school subject (achievement) and refer to this quantity as learning. Therefore, the more Careful, thorough and rigorous are the methods of our quantitative measures of achievements in an experiment, the more accurate we would be in measuring learning, predicting learning and understanding how students learn within school” settings. This is also true of socio-economic programmes’ investigations. The sketch below illustrates the framework of the three characteristics of an experiment, i.e.,, three major demands of experiments which we discussed above: Control, manipulation and observation.
Characteristics of an Experiment
Experimental
1: Control component
2: Manipulation component Expt. Treatment only is Manipulated
3: Observation component Careful, thorough and rigorous methods of measurement
Law of the single variable: apples in laboratory expts.
2: Manipulation component Expt. Treatment only is Manipulated
00
Experimental
1: Control component
2: Manipulation component Expt. Treatment only is Manipulated
3: Observation component Careful, thorough and rigorous methods of measurement
Law of the single variable: apples in laboratory expts.
2: Manipulation component Expt. Treatment only is Manipulated
3.3Threats to Experimental Design Studies
In order for an experimental research study to achieve its paramount goals of enabling the researcher make accurate and valid predictions and explanations of events or dependent variables with regard to their causality and so on, the activities which constitute the research itself must possess a high degree of validity and reliability. It may not have reliability and validity if the experiment is subjected to threats, there are two classes of such validity threats. These are internal validity threats and external validity threats.
Internal validity threats to experimental studies are those factors or activities which mitigate, confound and influence the manipulated independent variable of an experiment to the extent that its effects on the dependent variable are ‘altered (enhanced, removed or minimized). Therefore, an experimental study has a high internal validity, if threats which may mar the effects of the independent variable on the dependent variable, are removed or severely minimized. When internal validity threats are enhanced, removed or severely minimized, it would be possible but clearly wrong for the researcher to assert, that it was the experimental treatment that brought about the change in terms of (the observed outcome) its effects on the dependent variable. An assertion which is accurate, verifiable and sustainable in this regard, can only be made if adequate and necessary controls, manipulation and observations, have been carefully thought through and systematically carried out. If the three major characteristics of experimental research (controls, manipulation and observation), which were’ discussed in the preceding section, are accounted for, then the internal validity threats or extraneous variables which mitigate, confound and influence the effects which the independent variable has on dependent variable are removed. Generally, eight internal validity threats or extraneous variables have been identified to have serious alteration or confounding threats to experimental research in education and social science. We will discuss the internal validity threats, first
Pretesting: Pretesting which is the administering of research test to subjects before the actual commencement of a study, sensitizes them to become aware or suspicious of the purposes of the pre-testing aspect of the experiment. In educational settings most students prepare for their examinations from previous years’ examination/question papers. So having been administered a pretest, most students revert to preparing for the posttest by revising questions of the pretest. Ali (2oo4) has reported that at all levels of education, evidence shows that pretest questions are carefully, repetitively and methodically studied by students prior to the posttest, almost to the extent that any observed improved •performance on the posttest by the student subjects may well not be because of the effects of the experimental treatment, partly due to their previous level of preparation. Designs of experiment which have pretests suffer from this internal validity threat. Another source of threat has to do with the newness effect of pre-testing on the subjects. Some subjects may read meanings into the newly introduced pretest which is not normally done in the class or in the community and so become sensitized to the test and react more to it than to the experiment. This phenomenon is commonly referred to as the reactive arrangement or reactive effect of pre-testing on the subjects. Some researchers have suggested that reactive effect of pre-testing can be minimized through scrambling of the posttest items administered to subjects at the end of the experiment. Scrambling can be achieved through renumbering of the posttest items,, using colored paper different from that of the pretest, retrieving all the pretest question papers from the students after the pretest examination, among others.
History: Certain historical and unique environmental events beyond the control of the experimental research but which may have had profound effects on the subjects can confound the effects between the independent and dependent Variable of the study/ Historical events such as human and natural disasters, tsunami, strikes, famine, calamities, economic hardship, sudden changes in -the school year or curricula, undue anxiety,, wars, sustained^ disruption to academic activities can either singly or in combination, as the case may be enhance, disturb or stimulate subjects’ performance on the dependent variable. A longer experimental research study stands a higher*chance of historical events affecting it. Therefore, an experimental study should not be unduly long. one way of avoiding this is to carry out the experiment in phases, complete each phase and report it before embarking on another phase.
Maturation: Subjects, and indeed all human beings, do change with time regardless of what treatment condition they are exposed to. Between the initial test and subsequent test, the subjects may have undergone many kinds of maturational changes since they are influenced by several factors, not just that of the experimental treatment factor. Changes include becoming less or more bored, becoming more or Jess wise, becoming more or less fatigued, becoming more or less motivated, as the case may be. And each or all of these changes may produce an observed dependent variable which is then falsely attributed to the experimental treatment rather than to the maturational changes indicated above.
Instability of Instrument: If in an experimental design study, the instrument for data collection is not valid, reliable and appropriate or if the techniques of using the instrument, as well as observing and recording the data are not consistent and systematic, data obtained from such instrument or techniques are unstable. An instrument, which is faulty, or even one that is precise and valid when wrongly used will yield unstable data. Similarly, haphazard techniques in data collection yield unstable data or data that continue to change with the administration of each instrument. Researchers should guide against any sources of errors such as instrument decay (faulty, imprecision from repeated or overuse, etc.) which poses an internal validity threat to their work. For instance, if research assistants are used for recording observed data, care must be taken to ensure that they know what to observe, when to observe, what to record, how to record, when to stop recording either because of fatigue, boredom and lack of focus on what to record. otherwise, serious errors are introduced, during the use of the instrument, into the experimental data and these become serious internal validity threats. Under no circumstance should the same assistant be used for recording observation data for experimental and control groups. Why did we make this suggestion?
Experimental Mortality: Subjects in an experimental research study may reduce in number between the time the experiment commenced and when it ended. Losses in data can arise from illness, parental request for wards, to discontinue participation, movement of some subjects to another school, unwillingness of subjects to continue with the research, and incomplete data set. Imagine that in a study almost all the losses through mortality, were subjects in the experimental treatment group who had scored low in the pretest. Because those remaining subjects did well in the pretest, they would, most naturally do well in the posttest, not so much because of the effects of treatment as much as the fact that those students who scored low in the pretest did not do the posttest. Mortality is a problem in experiments which span for long periods.
Statistical Regression: If subjects are grouped on the basis of their pretest scores in addition to the interactive effect between pretest and posttest, there is also the problem of statistical regression. Statistical regression is a phenomenon in a pretest- posttest experiment in which extremes of data do affect the gain scores or the results that subjects of the experimental treatment (e.g. research evidence shows that the same subjects who have low pretest score do end-up having high posttest score) whereby the higher gain scores may be misjudged or misinterpreted as arising from treatment effect. The truth of any pretest-posttest design is, in part, that subjects in any comparative group who score highest on the protest are likely to score relatively lower on the posttest while subjects in any research group being compared who score lower on the pretest are likely to score higher on a posttest. Thus, the researcher should be aware that the subjects who scored lowest or highest in the pretest are not necessarily the ones that are going to be the same lowest or highest scoring subjects on the posttest. Therefore, regression as an internal validity threat occurs inevitably in any pretest-posttest design essentially because there is usually a regression of pretest-posttest means of the subjects toward the overall mean of the entire experimental group. Superior gain score differences between treatment and control groups may well not be a direct and entire consequence of the treatment effect on the experimental groups. In fact, gain score differences between groups are always affected, by regression, in any pretest - posttest design study.
Selection Biases Arising from Differential Selection of Subjects: Even when a researcher may not be aware of this, when he selects and groups subjects, certain criteria unwittingly influence who he selects and puts in a particular research group. When this happens, as it is bound to happen, there is the occurrence of none equivalent grouping of subjects prior to the commencement of the experiment. The general tendency, among unwary researchers, is for selecting and assigning better subjects into the experimental Group advantage, which enables these better subjects to do better them the control group subjects who were worse candidates before the commencement of the experiment and who, in any case, would be expected to perform worse at the posttest than- their experimental group counterparts. Under this condition, the researcher selection biases threaten the internal validity of his results since his results may well not have been caused, by the restraint but more so them the fact that, absent initio, the experimental subjects were favored and consequently performed better than the control group subjects and so, as would be expected, did better than control in the posttest result.
Influence of Earlier Treatment Experiences: Many researchers use subjects whose earlier history to exposure to other research -conditions they do not know of or care to find out. Such earlier research treatment influences may well affect experimental research findings either negatively, positively, or selectively to members of a particular comparative research group. For instance, a researcher may unknowingly use and group into experimental group I, more subjects who had just finished an earlier experiment on Communicative English Language Reading and therefore have more reading skills than the control group subjects most of whose members did not participate in the reading experiment project earlier completed by those who participated in the earlier study mentioned. Because of this earlier treatment exposure of reading skills on some subjects and none for their counterpart subjects, there is already an abolition introduction of unfair advantage conferred on the experimental group subjects and unfair disadvantage on the control group. So, on any research study the former are used for, involving reading, an undeserved advantage is conferred on them while for the latter an undue disadvantage is conferred on them in later experimental work involving, earlier treatments such as word problems, as in mathematics, English language and so on. To avoid this problem researchers should find out about earlier experimental experience of their proposed subjects so as to ensure that these experiences ^ fairly or evenly well distributed in the population they want to work with, and they can then randomly sample from that population.
External Validity Threats
External validity threats are those factors or events which affect an experiment and which minimize a study’s usefulness, relevance and practical applications of the results so much so that the results and conclusions of the experiment cannot be generalized to the real world; what use is an experiment to man if its findings have no practical value? Therefore, before embarking on a study, the researcher must ensure that the ultimate results of his work should be useful, relevant and of practical application to the social science and educational setting, by asking himself such questions as: To what real populations, school settings, administrative or social group settings, political settings, experimental variables, measurement variables, research analytical variables can the research findings and conclusions of my proposed study be generalized. If the answers to each of these questions is none, then the researcher should not embark on his proposed experiment. Even when his findings and conclusions are generalizable to the population, there are factors which threaten the substance of such generalizations. He must take care of the factors which threaten the study’s external validity (extent of generalizing one’s research findings to the overall popup these threats are discussed below:
Hawthorne Effect: situation under which experiment in education and social science proceed need to be controlled so that experiment can go on as naturally as possible rather than their going on under contrived conditions or because of subject’s response to novel conditions induced by an experiment. When experimental conditions are not adequately controlled, subjects’ reactions and responses to experiments may become distorted by the mere fact of the introduction of the research conditions. By subjects becoming aware of the new situation created by the introduction of an experiment in their class, village school, football team and so on, they may become resentful, feel preferred, feel rejected or inferior to other research group or even the population that was not used; some subjects may question, why us, not them? Any of these reactions and responses may leave some effect on the subjects. The effects such responses have would depend on how the subjects were affected by the newly introduced research-induced situations. Subjects’ knowledge of their participation in an experimental treatment, as the treatment group, may engender their contrived or biased response to the introduction of this new situation rather than as a result of the effect which the newly introduced experimental treatment had on the experimental group subjects. When subjects respond to the newness effect of the experimental treatment rather than to the experimental treatment itself, this is referred to as Hawthorne effect and it is a serious external validity threat to an experiment. Similarly, when control group subjects respond to their knowledge of the fact that nothing is done to them (they are the control) while something is done to their treatment classmates, they become non-challant about the research study or they become uncooperative with the researcher and his work. Such a non-challant response arises not as a result of the control condition but more so as a result of knowledge that nothing was done to them or happening to them. This response is the placebo effect on the control group subject. Hawthorne effect was first observed in 194o following experiments done at the Hawthorne Plant of Western Electric Company in Chicago and reported by Roethlisberger and Dickson (194o). In this study, the lighting conditions of three departments in which workers inspected small parts, assembled electrical relays and wound coils were gradually increased. It was found that production in all the three departments increased as the light intensity increased. After a certain level of high production level was reached, the researcher progressively reduced the intensity of light in the departments to determine the effect it would have on productivity. To the surprise of the experimenters, they found that productivity continued to increase. The researchers then concluded that the newness effect of introducing light to the employees and the mere awareness of their participating in the study, rather than the experimental treatment of increased lighting conditions led to the increase of production gain; the now so-called Hawthorne effect. Further experimental studies of the above nature done at the plant, using varying rest periods and varying the length of working days and weeks, respectively, produced the same Hawthorne effect. The reactive effect of subjects to the newness of an experiment has also been observed in medical research. Medical research subjects generally react to whatever the drug they receive is as treatment, regardless of whether the drug is the real one being tested (and which contains the pharmaceutical preparation) or the ones which are placebos (these are inert, harmless and blank drugs but look like the one containing the required pharmaceutical preparation being tested). By masking the real drug (experimental) from the inert ones (placebo), researchers are able to reduce subjects’ reactive effects to the experimental treatment since they do not know which drug is the potent one and which one is placebo (inert, harmless and blank drugs which looks like the potent one but which are actually worthless mimics, (the placebo). Again, if it is concealed from the subjects, i.e., the knowledge of who is in the placebo or experimental condition, at the end of the experiment, based on the observations made on both groups of patients (note that the experimenter does not participate in the study, a condition referred to as double blind), it is possible to determine how effective the experimental drug is compared to the placebo. By doing this, the problem of some patients reacting to the newness effect of the study than clinically to the potency of the drug used as treatment received (most people tend to feel better or say they feel better after they received drug treatment, regardless of the efficacy of the drug used) is minimized. But in education and social science research, we do not have the luxury of placebo, i.e., not administering anything to student subjects in the school in the control group or even worse, administering of fake control conditions to them. It is possible to minimize Hawthorne effect and other situations which contribute to external validity threats. Clearly a phased-in, fairly longer study, say, five to twelve months, would reduce the newness effect, by wearing off subjects’ reactive effects to treatment, thus eliminating Hawthorne effect. But it is unwise to do so because longer studies lead to mortality, maturational, and historical problems which then constitute themselves into internal validity threats. A more useful suggestion that minimizes Hawthorne effect and other situational external validity threats is to hold all the situations affecting experimental and control groups constant; randomly draw and assign treatment and control conditions to groups; do your best to manipulate subjects to the extent that they do not know that any research work, as far as the independent variable is concerned, is in progress. There are several ways of holding experimental research conditions constant for all the subjects in an experiment. These include treating them alike on all things and letting them know that this is so, except with regard to the treatment aspect of the independent variable. For instance, on a teaching effectiveness method study, duration of teaching; actual teaching time; teacher qualification and personality; topics covered and their scope; tests; apparatus used; language of instruction; learning environmental conditions, etc. must be identical for experimental as well as the control group. Again, if assistants are used in the research, they must be trained on what to do, how to do them with little distraction and how to do them effectively. They can be brought into the class or community where they will assist in the particular research study far in advance of the commencement of the experiment, so as to minimize the newness effect of their presence in class or the community during the actual experiment, since the subjects would have become used to them, with time.
Population Validity: In order to be able to make a valid assertion, based on one’s experimental results, about the population, the sample used in a. study must by typical of the population from which it was drawn. Sometimes, the population experimentally accessible (accessible population) to the researcher may not truly represent the typical population; for instance, primary school children from rich and affluent homes of Victoria Island, Lagos, do not typically represent the primary school population in Nigeria but the former group may be the only one that is readily accessible to the experimenter. Any generalization to the Nigerian primary school population based on samples drawn from experimentally accessible population creates external validity threat. on the other hand, a use of target population would permit valid generalization, based on samples drawn, about the target population. Target population is the typical population to which the researcher wants to generalize his conclusions and, consequently, draws his sample from that particular identified target population. Sample for a target primary school population would include pupils from a variety of socio-economic conditions; schools and pupils from all the different parts of the country; a variety of school types and so on. Usually, to obtain a sample which reflects the target population is difficult. This can be overcome by identifying the population, the major attributes of the population and using the specific attributes of the identified population as sampling frames, zones and or clusters, from each of which sample representatives of the population is drawn. For instance, if there are three categories of primary schools in Nigeria, say, well established, less well established and poorly established primary schools, each category is listed and its population and samples representing the three categories of primary schools are respectively drawn. If location is an important variable or attribute, then Nigeria may be zoned first into, say, five equal locations, clusters or zones, and primary schools belonging to the three categories mentioned earlier are identified and then randomly sampled from, i.e., each of the sampling frames, geopolitical zones or clusters into which the country was divided.
However, there is a problem about the suggestion made above. It is that of logistical convenience. Clearly, zoning, sampling, identifying population criteria of a very large country and sampling from identified criteria is a difficult time-consuming task; difficulty whose implications/are enormous in terms of time, cost, ability to manage the conduct of the study and so on. Despite these difficulties, if a study is going to be generalized to the target population it is better to have reliable knowledge about a more restricted population of this target, even on a zone-by-zone basis (although even in the zones some areas may not be included in the sample) than to have a far more restricted unrepresentational sample (pupils of primary schools in Victoria Island, Lagos). Certainly, it is wrong and misleading to use conclusions generated from studying unrepresentational sample; samples drawn from experimentally accessible population cannot yield data that can be reliably used to make generalizations about the target population.
Experimental Environment Conditions: The conditions under which experimental research takes place is equally important as the experiment itself. Extreme variations in the environments of different schools, home, communities, cities, and tribes, programme administration may singly or jointly influence outcomes of experiments. Similarly, outcomes of experiments influence school or community environments. However, what is important to the researcher before proceeding with his research, as far as the experimental environment of his study is concerned, is in his making sure that the environment implicit in his study are those existing or attainable in typical schools, community, home, etc. in the area he is doing the study. An experimental environment in which calculators, photomicrographs, computer simulated teaching episodes, or strange external research officers in a village etc. are used in, are not typical environments, except in rich, well-established suburban primary schools (and these ignore the rural, depraved schools, or situations rural folks may not be able to handle).
Finally, all the types of threats discussed in the foregoing section highlight the enormity of demands, involvements and expectations of work that is of experimental nature, in education and social science research. Knowing what these threats are, is important. But far more important are ways and means through which the researcher can control and minimize, if not eliminate their effects, on the experiment carried out. These specific ways and means have been described in this section. Having indicated the design of experiment for the study you want to undertake, you must understand the implications or demands implicit in the chosen design. You should also anticipate what the threats to your experiments are likely to be as well as how the potential threats will be minimized, if not removed.
3.4Types of Descriptive Research Design
Having discussed the different types of experimental design, their characteristics and threats to their validity, it is only fair that we give equal emphasis to types of descriptive research designs in this book. It is as well fair that we do so because a large number of studies in education and social science use descriptive designs. The need for understanding them and how to improve on them is therefore, important if their sustainable and useful knowledge value and contributions to education and social science are to be enhanced, for entry-level researcher, it is the firm belief of this author that the comprehensive discussion of types of descriptive research design, with regard to their nature and scope, will help in the envisaged enhancement. Consequently, we will for now discuss survey, case study, evaluation and causal-comparative designs, even though there are other types of descriptive research design, such as gallup poll, correlational studies, ex post facto studies, market research, impact studies, evaluation studies, longitudinal studies, and so on. We will discuss this other design separately but more briefly.
Survey: A survey is a descriptive study which seeks or uses the sample data of in an investigation to document describe, and explain what is existent or non-existent, on the present status of a phenomenon being investigated, in surveys, views, facts, etc. are collected, analysed and used for answering research questions. Typical surveys develop a profile on what is and not why it is so; they do establish not relate one variable to another. Rather, information is gathered on the subject of investigation and described. For instance, Census of a country’s workforce population is a survey to find out attributes and number of people in a particular region, state, area, country who have or do not have jobs and so on. Such data can be used for problem solving, planning, electoral office zonal allocations based on population number representations, and so on. Some surveys measure public, opinions on major burning, social, political and educational issues. There are therefore a wide variety of survey types. These include, for instance, a census of tangible subject matter; a census of intangible subject matter; a sample survey of tangible subject matter; and a sample survey of intangible subject matter. In the census of tangible subject matter, a small sample is used for seeking information on a single subject or issue at a particular time. An example of this is a census of the number of professors at the Ambrose All University, Ekpoma, Nigeria, in 2oo6 or the number of senior lecturers in the Faculty of Law at the University of Lagos, Lagos Nigeria, in 1999. It could also be the number of Nigerian master’s degree candidates produced from 199o _ to 1999; disciplines at the University of Nigeria, Nsukka, Nigeria. Information gathered from census of tangible subject matter is “definitely useful for planning, albeit, at the local level, despite its confinement in scope. In a census of intangibles, a survey is undertaken on several issues from which a construct is derived indirectly. A construct such as the center of excellence in law or the best university in Nigeria would involve deriving this decision based on ranking all Nigeria Universities on observed survey records of their performance. Ranking will be based on several academic and non-academic criteria such as stability/staffing, quality of staffing, staff-student’s ratio, library facilities, research capability and output, laboratory facilities, municipal services, students’ academic records of performances, academic award, growth rate, staff academic publications abilities, age, landscaping of grounds, safety and security of university and so on. So, you would expect that census of intangible subject matter poses many difficulties. For instance, based on the examples noted above, there is the difficulty of developing valid and reliable measurement criteria and instruments satisfactory and useable in all the universities to be surveyed. There is also t e problem of whether one can reduce census of intangible subject Matter data into a construct (e.g. best university, the best study? whose meaning is clear to and acceptable by all persons survey Again, constructs vary from place to place and even in on they vary from time to time and one person to and observation is largely responsible for our inability to successfully and satisfactorily develop and use instruments for measuring many constructs in social science and education. Indeed, to date, constructs in social science and education such as attitude, interest, psychological adjustment, reinforcement, cost and benefits of a social programme, leadership, student motivation effective teaching and so on have not been rigorously defined and become acceptable frame of reference for these constructs and agreed upon by all. In a sample survey of tangibles or tangible subject matters, a researcher investigates quantifiable phenomena using a large sample. An important sample survey of tangibles was the Lunge Report (1991) commissioned by the Federal Government of Nigeria to advise it on many issues related to funding higher education with particular reference to Nigerian universities so that they can better perform their statutory functions of teaching, research and public service. Another important example of a sample survey of tangible subject matter is the Coleman Report (1966) which was a survey of 600,000 children in grades 1, 3, 6,9 and 12 in approximately 4ooo American schools (largely representative of American private and public schools) to find out the nature and scope of educational opportunities, offerings and facilities in these schools. The findings of this sample survey of tangible subject matter led to the establishment of information on the relationship between a school’s geographical location and its measure on the factor of facilities, class sizes, educational opportunities, teacher qualifications, course offerings and so on. Such information was used for planning and redressing the ills arising from the observations of disadvantage in schools in particular geographical location including rural schools in the Deep South that were mostly disadvantaged because of their isolated locations, in a sample survey of intangibles, an attempt is made to reach a psychological or sociological construct by sampling a large population and deriving from the data obtained, some information about the particular psychological or sociological subject matter that is of interest to the researcher. For instance, how someone is aging to vote is intangible; so also, is what car he will buy or his opinion on sex education in schools. But these constructs - political references, buying tendencies, and sex education preferences and so on must be measured. These are difficult constructs to attempt to survey and establish but researchers undertake them because of their immense usefulness to society. Voting preferences research studies have become more and more accurate as a result of speed in 5 telephone data gathering techniques, careful and representational sampling techniques and computer-assisted techniques in speeding up and accurately reporting data. It is indeed now possible for predict the outcome of an election and opinion poison any issue based on preliminary sample result. Based on the observed polling tendencies of a few precincts (polling stations) in some states in America (Eastern states), it is possible to accurately predict presidential elections even when elections are still going on in Western states. There are four time zones in America (Eastern, Central, Mountain and Pacific), with an hour differential between time zones; in effect once, elections are concluded and counted in the Eastern and Central » time zones, prediction about the outcome of the election are made by the media and pundits. Such predictions are always very accurate. Prediction based on polls are more likely to be accurate if the number of undecided responses is small as not to tilt the direction of preference. So, if the number of undecideds is too large, the chances of making a wrong prediction increase. Ali and Design (1985) have reported that even though survey results can be abused and misused, survey research is very useful in educational and social science planning and development. But as would be the expected, a large number of survey studies in education and social science are sea e parochial, and inconsequential investigations and have en one y undergraduate research students who usually over a particular area and use less than adequate research skills and instruments in doing so. Many principals of secondary schools have become peeved and indifferent to responding to questionnaires on leadership styles; indeed, some prepare and keep in their drawers or minds, answers ready for the next set of student-researchers’ questionnaire. Little wonder then that there is a lot of distortions in questionnaire data arising from arbitrary responses; small number of responses; error in analysis and sometimes introduction of researcher biases for political and economic gains. Indeed, this last disadvantage (among others) to survey studies have been largely leveled against some pollsters who “fix” figures to attempt to win elections for favored politicians who (they show as leading in polls even before elections are held; an indeed a sordid interference. But the author and perhaps many other researchers have faith in survey studies. What is needed to make them more valid, more reliable and. ‘more useful for educational and social science planning and development is to sharpen the research skills and perceptions of researchers planning to undertake surveys in these areas. A simple rule of the thumb is for the researcher to fully know the nature and scope of the problem he is investigating; the identification of the particular useful sources of data; obtaining full cooperation from the data source, developing and using relevant and reliable instruments for data collection; carefully collecting data from a properly composed large sample; and analysing and interpreting the data correctly for answering research questions related to the problem investigated. In some cases, the researcher must use a guide or assistant familiar to a research situation and good public relations to seek and obtain survey information useful in his study. This is very true of survey studies in which interviews are involved.
Case Study: A case study is an in-depth intensive investigation of one individual, a small unit or a phenomenon; a small unit could be a family, school, a church, a disability class, an economic regime while a phenomenon could be the impact of unemployment among coalminers in a town, say, Enugu. The case study approach as a means of documenting social reality, lifecycle, change or growth has a long history. Ancient Greeks based much of their logic on close one-on-one observation of individual events, etc. as a basis for logical conclusions upon which their theses or most decisions or facts about different subjects depended on. Despite the fact that a large number of earlier case studies in education and social science were unscientific, mainly because of their lack of depth and rigorous research controls, its humble beginnings and contributions as one of the major tools of researching and revealing human events and changes as well as how children learn must be appreciatively recognized. Indeed, one would say, that the nature and scope of human intelligence and behaviours, as we have found out, has become unquestionable based on case study research. For instance, much of the work of Sigmund Freud, Jean Piaget and a host of their followers were case studies. And from these case studies, educators, psychologists, economists, sociologists etc. have indeed learned a lot about human behaviours, growth and development. The underlying rationale for case study is the belief that probing and studying intensely one typical case can lead to insights into our understanding of other identical or similar individual cases, events, and social units, etc. typical to the particular case studied: if you study one case, you have by implication studied others similar to the one case studied. Clearly, this poses the problem of determining what is the typical case, event or social units that should be studied especially with regard to how typical is this one case, etc. vis-a-vis the other cases (ensuring that the particular one investigated must be identical to the others not investigated). There is no one way of knowing how representational the one case studied is to other uninvest gated cases; it is not entirely likely that the one case studied has all the attributes or characteristics of the other cases in the population not studied.
This problem can be overcome i f carefulness anti thought fullness are exercised in selecting a case for investigation so that whatever case is selected would be a fair and adequate representation of a whole range of cases similar to the one being investigated. Even when lilies feature is not attained by the researcher, it should be borne in mind that a case study is not an experiment and conclusions from it cannot, with great certainty bemused for prediction or conclusion about other cases. one case cannot be generalized to all the other cases or for establishing causation. Case study approach demands intensive and extensive data collection work, the more thorough and’ systematic the instrument, developed and used for case study data collection is, the more useful and sustainable is the case study. Data collection instruments are of various types and largely depend on the type of issues addressed in the case study involved. In the historical case study, documents, artifacts, memoirs, interview and questionnaires, may be used to find out from subjects the historical growth and development of a particular issue, event, school. For instance, a case study can be done on the history and development of Mayflower College, Ikenne. Documents of historical significance may be collected from Newspapers, courts, personal and old boys photo albums and from records kept in the school. During visits to such a school, the researcher can cross-check or match information with - actual scenes, places and -objects. In situational exam malpractice case study, the researcher looks at the scripts of the candidates and interviews those directly involved in examination malpractice, as Well as interview those not directly involved in the subject-matter of the case study. Those not directly involved may include other students who sat for the examination but were not involved in the examination malpractice, malpractice-involved student suspects’ academic records, examination invigilators’ reports, and so on. Clinical case study involves investigating a child with a specific social, emotional or learning disability problem in which the researcher would generally employ the clinical interview and record keeping observational technique. It could also involve some testing, interviewing friends, and looking at the subject’s previous work record. From all these stores, a diagnostic prescriptive data profile is built up for the subject for use in rating the occurrence, frequency and severity of a particular phenomenon being investigated such as a deaf pupil’s response to tactile (touch), mode of learning the structural features of plants. Such a profile is then used to effectively teach him, on a one-to-one basis, especially because the teacher has diagnostic and prescriptive information about the particular child.
Case studies have been successfully used for investigating a wide range of individual’s behaviors and preferences, socio-economic Events, geographical phenomena, cities and so on. Social case study issues include, Siamese; twins, gifted children, alcoholics, fibrates or nomadic persons, Quakers, American Indians, poor whites, absenteeism, armed robbery, death penalty and so on. Indeed, many case studies on urban change, such as those by Lucas (1999) and Momoh (2oo4) have cumulatively lead to the acceptance of hypothesis on urban- rural migration and development. Despite its usefulness in developing” our understanding of certain events and the vast range of appeal it offers in terms of large number of uses which it serves case study approach to research has some limitations; indeed, it may be that its strength provokes and creates its weaknesses. Because the case study emphasizes in-depth investigation, by doing this, they inevitably lack breath; when we dig deeper, we lose vision of what is on top and beneath other areas we % did not dig. Also, because of the opportunities to really dig deep on a case study problem, on a one-or one basis, there is the danger of researcher subjectivity and too much closeness with the subject of investigation. So much is this possibility real that he becomes a victim of his own prejudices, fears, mannerisms and other personal factors rather than working objectively with the subject. The case
study research approach may appear simple but in reality, it is difficult, strenuous and time- consuming, given that volumes of data are collected through painstakingly methodical, and skill-demanding counseling sessions, data sifting sessions, travels and so on, each of which requires efforts, skills and patience. Because of the technical procedures of case studies and the fact that some researchers who use this design must be familiar with and use terms applicable in their profession such as in Psychology, Economics, Political Science, Education, etc., there is often the tendency for some case studies to be reported in constructs, terms, principles, behaviours, etc. that are undecipherable, difficult to confirm or refute through replicating the same case studies, let alone doing so through empirical experimentation which may be an inappropriate design for use. Some ease studies have tended to wrongly project their results as causative rather than those results merely being predictive or associated with the observed phenomena. If, for instance a researcher studied the influence of different noise levels on a student’s achievement in Mathematics and found that sonorous low-level noise resulted in the student’s better results in Mathematics, a conclusion of sonorous low-level noise causing superior achievement in Mathematics is spurious. This is because, at best, this level of noise is related to but not the cause of superiority of Mathematical achievements among most or all students. Any effort at establishing causation based on a case study research conclusions result in Post Hoc Fallacy and this issue we will be discussed in the next section of this chapter.
Causal-comparative Design: For one to reach a conclusion that one variable (X) causes another variable (Y); three necessary preconditions must be fulfilled. The first precondition is that statistical relationship between X and Y has been established through alternative hypothesis testing that was upheld. Secondly, it must be the case that X variable preceded Y variable in time. The third condition is that all the threats to the study have been taken care of through randomization, proper manipulation of treatment within the experimental controls, careful observation techniques and the careful and accurate manipulation of independent variable. Without these preconditions met, there is no way the researcher can authoritatively claim that X caused Y. only a true experiment satisfies these three necessary conditions which is why it enables us to make inference of causality between X and Y„ following the acceptance of a tested alternative hypothesis. Rarely in social science and education research is it possible of practical and even thinkable to undertake experiments which would enable us fully and absolutely meet all the conditions of Controlling X, i.e., control all independent variables c (intelligence, attitudes, preferences, aptitude, motivation) as we hold all other variables at bay or constant while determining through experimentation; their effects on Y (dependent) variable. When such controls are not possible, we can investigate the relationship between X) secretively rather than through experimental design studies. In Joining this, a descriptive study where X and Y are observed and reported without X being manipulated to determine its effects on Y, is not an experiment. Any relationships between X and Y observed and reported were pre-existing in the subjects and so X did not cause Y. A descriptive study, which determines the relationship pre-existing between X and Y is referred to as Ex Post Facto or causal-comparative design. For instance, a researcher may notice a particular event (tallness) among his physics students and observed that- such students do well in physics. In a causal-comparative design study, he would sample a group of tall Physics students and another group of short physics student and test the groups on a physics achievement test. Using at test statistics o^ comparison of the significant difference between the two-groups dependent means, he may, in fact, find that a significant difference occurred between both means, in favor of tall students, us significance enables him to establish that a positive relationship exists between height of students and their academic achievements in physics. As noted earlier, the design here is Ex Post Eaclo or Causal Comparative. Note that he cannot establish a cause-effect relationship between tallness and physics achievement because he has not manipulated height experimentally, and controlled or kept all other variables at bay, to determine the effects of height on students’ achievements in physics. one of the most unfortunate problems of undertaking an ex post facto or casual-comparative study is the danger of using findings based on an ex post facto or casual-comparative design as a basis for reaching a conclusion of causality. It is wrong to do this. When a researcher does this, the problem of falsely making a causality conclusion rather than a relationship conclusion, based on the findings in an ex post facto or casual-comparative design study, is referred to as Post Hoc Fallacy. Even when there is a high and significant relationship, as measured by subjects results on a dependent variable, all we can establish in an ex post facto design study is that the independent and dependent variables are positively related; note very clearly that the independent variable has no effect on and does not cause the dependent variable. Two classical examples of Post Hoc Fallacy are The Car Seat Belt Research Studies reported by the Volvo Company in Sweden and made public in 1968 by the U.S. and World Report (January 29, 1968, page 12) and the numerous cigarette-cancer studies. In the seat belt research studies, from the evidence available it was concluded that in road car accidents, seat belts reduced 69% of skull damage among drivers and 88% for passengers and, again, that seat belts reduced facial injuries by 73% for drivers and 83% for passengers. Clearly, the distinction must be made that seat belts are closely related to reduction of danger of life during vehicle road accidents but are not the cause of such reductions. other factors (road conditions, human luck, the response of driver to an appropriate and equally, if not more so. contribute to and are closely related to road accidents End death? from automobile accidents compared seal belts alone. The conclusions of the Volvo studies reducing roads and road accidents led to the present mandatory of seatbelts on all U.S cars. The mandatory installation and use of-seat belt on all cars in Nigeria, as from January 2oo3, while driving- may well have reduced or led to the reduction of accidental injuries and deaths during car accidents. As you would expect, it may have added more cost to car buyers at a time injuries sustained from car accidents may have reduced because most people who put on seat belts while driving are consciously careful, and putting on a seat belt subconsciously evokes carefulness in one. While driving, anyway. If some measure of driver’s carefulness occurred before the accident, it is as well expected that injuries would decrease among car seat belt wearers who are the ones careful driving their cars, to begin with, anyway. With road safety agencies in Nigeria free to thrive on brute force in their so-called road safety operations, it is understandable why research hardly plays any role in guiding their behaviors on the job and professional responsibilities. It would have made more sense if Nigerian road safety agencies carried out simulated experimental studies on what causes road accidents in the context of treacherous Nigerian road conditions that need no description and painstakingly address the causes than merely ignorantly enforcing seat belt use while driving. Clearly these agencies need to know that conditions that cause road accidents and death from injuries are, all too often beyond the entrainment of a driver and or his passengers, by seat belts. The outcomes of studies on cigarette-cancer dimension again have established spurious cause-effect relationship between both even though we should know better. Recent clinical studies in Germany and the U.S. have shown that certain persons have glandular imbalance which has clinical tendency to cancer. Glandular imbalance, clinical research shows, induces a certain amount of nervous tension. Since excessive and sustained smoking of cigarette is a type of nervous’-tension release, it is therefore not surprising that such individuals who have glandular imbalance smoke heavily. Again, as would be expected, cancer could therefore result from the glandular imbalance which was in the smoker before he even began smoking, rather than from the smoking which is a type of symptom. Also, note that all cancer patients did not smoke and all those who smoke do not have cancer.
This error in making false and misleading conclusion of cause-effect relationship between cigarette-smoking and cancer is only now beginning to aid and broaden our understanding of the nature and scope of relationships between both cancer and smoking and the kinds of psycho-clinical treatments useful in stopping the cancer symptoms by treating the glandular imbalance first and then getting the smoker to stop smoking. It took us this long to also know that lots of people who develop lung cancer do not smoke or have never smoked before! Also, we have found that most smokers do not have lung or any cancer! Nonetheless, because smoking cigarette and indeed tobacco, is closely associated with many forms of respiratory ailments1, among others, a wise smoker needs to quit-smoking to avoid making himself a highly potential or vulnerable victim of such ailments, as he gets older.
From the foregoing, it should be apparent that there is need for caution whenever ex post facto or causal-comparative design is used in a research study. Caution is necessary so that the researcher is aware of the difference between—causation and prediction. only findings based, on experimental design studies can enable the researcher reach conclusions for establishing causation (cause-effect relationship between X and Y variables). Ex post facto or causal-comparative design merely enables us to establish a relationship between X and Y (i.e., X and Y go together) in which case X predicts Y, but X docs not cause Y. once these sequences are understood, actually, there is therefore no worry about Post Hoc Fallacy or the establishing of a cause-effect relationship where none exists.
Ex post facto or causal-comparative design is quite useful in educational and social science research as a means of undertaking studies in which independent variables among the subjects (aptitude, personality, age, teacher competence, preferences,, prejudices, intelligence, cultural traits and so on) already exist and cannot be manipulated or controlled for or in studies where subjects possessing these variables, at different and varying degrees, cannot be randomly assigned to treatment groups. It is also a design which allows the researcher to proceed with his work by looking at only one and independent and dependent variables at a time even though it is obvious that in real life seldom is one variable only (X, alone) related to another variable (Y, alone), while other variables arc held constant.
Which Design Should I Choose
In the earlier sections of this chapter, we discussed a number of the different kinds of experimental and descriptive designs. Clearly, we did not exhaust them and indeed no one book on research exhausts all the very many research designs there are. With more and more advances in research techniques, new but hopefully better designs are bound to emerge.
Because there are many kinds of experimental and descriptive designs, the researcher is sometimes confronted by the problem of choosing a research design which he deems appropriate and adequate for use in his research work. There are a number of important considerations which should guide one’s choice of an appropriate and adequate design for use in research. The first of these considerations is a clear understanding of what the aim of the study is. If one in intending to find out or establish an erasure effect relationship between X and Y variables (independent and dependent variables) and in which X is manipulated to find its effects on the dependent variable, experimental design is called for. This is because experimental designs provide the only systematic, scientific and incontestable basis for establishing cause-effect relationship. In an experimental design study, hypotheses are stated and tested using data obtained through systematic and planned controls, manipulation and observations between treatment and control groups. Experimental data are used for accepting or rejecting the stated hypotheses. If on the other hand, the aim of the study is to describe, explain, document, or identify certain events naturally existing in the schools or one classroom, at the state education commission, or over a long period in a rural setting, or the finding out efficiency levels of agencies that conduct elections, for example, then the design called for here is a descriptive one; i.e., a survey, or a case study, longitudinal, market survey, or a historical study, as the case may be.
Having decided to go experimental or descriptive, based on the aims of your research work, as discussed in the preceding paragraph, there is then, next, the important consideration of which specific design within the experimental or descriptive broad categorization 7oU want to select and use for your proposed study. To do this, you would take a close look at the different designs within experimental or descriptive framework and make a choice. Perhaps your choice may be a post-test only, equivalent group design (a true experimental design) or a census of intangible subject matter survey (a survey design). Having made this choice, you need to be clear in your mind that, like the man embarking on building a huge mansion, you have most, if not all, the skills it will take to execute this enormous task successfully. Whatever design you choose, you must have the necessary resources of time, money and research skills preconditioned to successfully executing the demands imposed by the chosen design for the particular study. Sometimes, research students select one type of descriptive design or the other under the false and misleading impression that it is simple and easy to undertake descriptive studies. They tend to forget that descriptive studies are more than just asking subjects their opinions, views, or seeking to identify the attitudes of respondents one an issue and reporting them. Descriptive studies involve a lot of work including using appropriate sampling technique, carefully carrying out the instrument construction and validation, training of research assistants to minimize inter-rater discrepancy, while using the instrument, travels to administer instruments and retrieve them, and.so on. If one were to want to do a historical study on the roles of past missionaries and their impact on education in Nigeria, one would be quite prepared to literally spend ages sifting through useful information from archival documents (legal and legislative documents, missionary records, memoirs), interviewing many people, and several other in -built work; but on its face value, the topic seems simple enough as an easy work
on the other hand, some research students adopt a true experimental design as a show-off of their supposed adeptness at doing experimental research. Among such students, little or no consideration is given to how they would meet the demands of an experiment as implicit in the chosen design. They may not be fully aware at all that experimental research design imposes several demands on the researcher including that of randomization of subjects; identification of distinct research conditions of experimental treatment and control as well as the identification of the treatment and compliance to it, issues that demand ethical considerations; systematic development of test instruments for use in observation and recording of dependent variable; devoting time and resources to the setting up of experimental conditions in the school, laboratory, workshop or us the case may he; undertaking of u feasibility study to determine whether it is even feasible to set up an experimental condition as envisaged; knowing the kind of data to he collected and the appropriate analytical tools to use; as well as other compelling experimental design demands.
Another important consideration which should guide the researchers’ selection of a particular design for his study is that of his awareness of the advantages and disadvantages of what the study is aimed at accomplishing. For instance, a study which intends to provide a very rigorous experimental test of a cause-effect nature must eliminate the disadvantages of pretesting, selection of subjects and use of instruments whose psychometric properties are not high or even known. Therefore, the design that has a clear advantage here, vis-a-vis eliminating the earlier mentioned disadvantages, is either the post-test-only equivalent group design or the Solomon Four (Iron/) Experimental Design. because the Solomon Four/Group Experimental Design involves far more rigorous and demanding Work than the post-test only equivalent-group design, the latter should he chosen unless one is an expert researcher, only this should he settle for the latter design
When the research student has chosen a research design for his work he should then discuss ‘his choice with his supervisor. A discussion such as the one suggested here is necessary for a number of reasons. Firstly, the supervisor and his student need to agree on the design best suited for the student’s work so that there is no question of working at cross-purposes later. Secondly, the supervisor may have the need to make justified modifications, even if they are minor, to give a sharper focus to a planned study or some aspects of the research work already in progress. But ultimately, whatever design a researcher chooses is his own prerogative. This is why it is important to give thoughtful consideration to such issues which will enable him choose a design that will ensure that he successfully completes his study as well as achieve the aims of his study. Some of such issues, in addition to the points made earlier in this section include ensuring that your research title agrees with your design e.g., studies whose tittles begin with, effects of, effectiveness of, etc. are experimental, studies that examine relationships between X and Y for predictive purposes are correlational or Ex post facto, studies that survey an event over a long time are longitudinal; those that make value judgment on programmes, projects, against certain pre-determined criteria are evaluation; those that document events of the past and changes that have taken place are historical; and so on. The design selected must also agree with the problem statement, the particular research methodology to be adopted for the study and the appropriate statistics to use, as well as the relevant and related conclusions to be validly made. If you take the last issue that is the conclusions to be made, a conclusion based on a survey cannot be ascribed to causation, rather it should be totally descriptive or exploratory or explanatory. These are the reasons why the design of a study affects all aspects of any research work and due thoughts need to be given to selecting a particular design.
With regard to what you put down in your thesis booklet when you choose the research design to use for your study, you must refer to it by its specific name, e.g., the design (to be used) used in this study is correlational. Then you need to describe what the design is or involves i.e., you need the definition, given by experts of what the design is. You also need to justify the selection and use of the named design vis-a-vis the type. -of study you are carrying out. other information you would need are the purpose of using the design, how the-design would be used in the study, among other points.
Summary
Research design is a blueprint, roadmap or plan of action regarding the systematic implementation of investigation-based events which upon implementation would enable the researcher effectively and appropriately document the accurate facts about the investigated problem of his study. There are, as we discussed earlier, five components in a typical research design. Basically, there are two types of research design, the experimental and descriptive designs. Experimental designs are more rigorous and demanding because of their compelling characteristics. Certain considerations are important as preconditions to deciding on which research design to choose for a study. These considerations must be thought-through before one finally chooses a particular research design for his work.
Exercises
What is research design? Identify and discuss the importance of research design, in a systematic research process.
How was the design for your proposed research selected?
Why is a particular research design preferred to another?
List and describe three components of a research design?
Which research design would you use for your thesis and why?
Ethical Issues in Scientific Research
C.N Nwanmuo
Introduction
Many of our researches in Natural science, social science and Education involve the use of human beings to collect vital information, rights of the people involved in scientific research must be protected, chapter therefore, pointed out some of the rights of research participle to be protected. The chapter ended by discussing ethical dilemma scientific research.
The justification for ethical standards in scientific Research
The History of Unethical scientific experiments can be traced back Nazi Medical Experiments of 193os and 194os where prisoners of held in concentration camps subjected to different kinds of all treating Nazi medical experiments were designed to test the limits of held endurance, reaction to diseases and untested drugs (polite and Hun 1995). The trails of 23 Nazi medical doctors who participated in medical experiments (popularly known Nuremberg trails) lead (establishment of first ethical standard referred to as Nuremberg C Thereafter, other disciplines (such as sociology and psych° established their own code of ethics.
1o.3. Ethical Principles
Nazi medical experiment at the concentration camp was not the experiments where human rights were violated Jones cited by Alim
The Tuskegee experiment
In the Tuskegee experiment between 1932 and 1972 the US Public Health service denied effective treatment of 399 African Americans who were in the Late stages of Syphilis, a disease which can involve tumors, heart disease, paralysis, insanity, blindness and death.
The men were not told of the disease from which they were suffering and were, for the most part illiterate and poor.
The aim was to collect information at autopsy so that the effects of the disease in black sufferers could be compared with those in whites. In practice, the results at the study did not contribute to the control or cure of the disease. In 1997 president Clinton issued a public apology for these government. Sponsored actions to the few remaining survivors.
It should be noted that unethical researches also occurred in social sciences. For example, Milgram (1974) and Humphrey (197o) were social researches conducted that violation of human rights. In response to the violation of human rights during scientific research, the National Commission for protection of human subjects of Biomedical and Behavioral research issued a report in 1978. The report (sometimes known as Belmont Report) articulated three ethnical principles on which Standard of ethical conduct in research are based
Beneficence
Respect for human dignity
Justice
16.1 Introduction
In chapter 15, we described four levels of measurement together with scales for each level of measurement. This chapter focused on how to construct one of such scales, the Likert Scale. By the time you read chapter 17 you will discover that the questionnaire used for social surveys incorporate Likert scales.
16.2 What is a Scale?
Even though we described four scales that are used in measurement in the last chapter, it would be helpful at this juncture to have a simple and clear definition of a scale. Certainly, such definition will help you in the construction of a Likert scale. A scale is a device designed to assign a numerical score to subjects, to place them on continuum with respect to the attribute being measured. Scientists have so far developed different types of scales for measurement of different constructs. Examples of a scale include the Likert scale, Thurston scale, Guttmann scale among host of others.
A scale can be unidimensional or multidimensional. It is unidimensional when it measures only one dimension of a construct. If a researcher is interested in measuring one dimensions of learning, say cognitive learning of students, he has to construct only unidimensional scale (i.e one scale). Sometimes a researcher may be interested in measuring more than one dimension of a construct. In case of learning, he may want to measure affective learning in addition to cognitive or he may even want to measure the three, that is, cognitive, affective and psychomotor. For these measurements, a researcher has to use multidimensional scale with three scales each measuring on dimension of learning. This chapter considered only Likert scales and they are useful in the measure of one dimension of a construct.
16.3 Concept of Likert Scale
Likert scale is a scale named after its inventor, a psychologist called Rensis Likert, who developed it in 1932. It consists of positive and negative declarative statement (items) concerning attribute (construct) to be measured. Each statement is accompanied by five or seven response categories (options). These response categories can be “strongly agree”, “agree”, “undecided”, “disagree” and “strongly disagree. Some researchers use “very important”, “important”, “neutral”, unimportant, and “very unimportant”. others use “very adequate”, “moderately
Each response category is assigned with a numerical score. With a positively worded statement, the following response categories are quantified as follows:
Strongly agree–5
Agree–4
Undecided–3
Disagree–2
Strongly disagree-’1
If the statements are negatively worded, we reverse the coding of response categories as:
Strongly agree–1
Agree–2
Undecided–3
Disagree–4
Strongly disagree–5
Note that the numerical scores (1,2,3,4 and 5) represents the intensity of the response categories. The higher the number, the higher the intensity. The following two scales show examples of positively and negatively worded statements concerning measurement of attitude of people toward Technical Education.
People that studied Technical Education become rich in future.
Strongly agree–7
Agree–6
Slightly agree–5
Undecided–4
Slightly disagree–3
Disagree–2
Strongly disagree–1
Women should not study Technical Education.
Strongly agree–1
Agree–2
Slightly agree–3
Undecided–4
Slightly disagree–5
Disagree’–6
Strongly disagree–7
Likert scale should contain equal (or approximately) number of positively and negatively worded statements. The idea behind this suggestion is to eliminate bias in selection of the responses. To measure a construct (variable) using Likert scale, the. measurer provides a series of positively and negatively scales items together with their respective response categories. Respondent selects one response category for each scale item. The numerical values corresponding to the response categories selected are sum up to represent his or her attitude toward the construct or variable understudy.
Let us use a hypothetical example to illustrate the process of measurement of attitude using Likert scale. Suppose in an effort to measure the attitude of Nigerians toward Technical Education, a researcher developed four-item Likert scale shown in table 16.31. Let us assume that the table represent the response of only one research participant.
Table 16.31: likert scale for measurement of atitude of Nigerians toward Technical Education

Key
SA = Strongly agree
A = Agree
UD = Undecided
D = Disagree
SD = Strongly disagree
√ = Selection
Looking at table 16.31, one can see that it contains equal number of positively and negatively worded scale items. It should be noted that in practice we do not show the direction of scoring on the scale. I only showed such direction for clarification purpose. The total score of the research participant is 4 + 4 + 5 + 5 = 18. We can see that in this example, individual’s scores for each item are sum together to get the final score (18). Hence, Likert scale is summated rating scale.
16.4 Writing Scale Items and Response Categories
Scale items and response and response categories a like scale. Therefore the abilities of a likert scale to measure dependent on how well you construct them. Beginning researchers often asked:
Where do I get my scale items?
What and what should be included in my scale?
How may scale items make up a Likert scale?
How do I measure a construct more accurately?
There are many sources of scale items. These include review of literatures, reading theories or conducting focused interviews. A researcher may decide to use readymade scale items suitable to his research, modify existing scale items to suit his research or generate new ones. Before selecting scale items to be included into a Likert scale, a table of specification should be constructed. one of the remaining question is answered in next section while the other in chapter 17 and 32.
16.5 Steps in the Construction of Likert Scales
Construction of Likert scales involves the following steps:
Compilation of scale items
Administration of the compiled scale items to a random sample of respondents
Determination of discriminative power of items
Selection of scale items
Test of Reliability
Compilation of Scale items
once the construct of interest is identified, the researcher compiles a series of scale items together with their response categories that measure the construct. The response categories (options) for each scale item can be five, seven or any suitable number. As stated earlier, the scale items should be mixture of positively and negatively worded statements. The scale items of table 16.31 are typical examples of scale items compile to measure the attitude of Nigerians toward Technical education. As stated earlier, a beginning researcher may ask: how may scale items constitute a scale for measuring a construct? The number of scale items depends among other things in the scope of the study. Suffice it to say, whatever the case may be a researcher should be guided with the fact that too many scale items about a construct in a questionnaire lead to either non-return or bias in selecting responses.
Administration of the compiled items to a random sample of respondents
Random sample of respondents from the target population who are not selected for the research are asked to select a response category that is the most closely reflect their view for each scale item.
Determination of Discriminative power of items
one of the goodness of an attitude scale item is to distinguish people who are high on the attitude continuum from those people who are low. In fact, the ability of a scale item to discriminate those who are high on the attitude continuum from those who: are low is termed as its Discriminative Power (DP). Scale items with high values of DPs are retained while those with very low values are dropped.
To calculate the DP of a scale item, the researcher place the scores of all respondents in an array from lowest to the highest and then select the upper and lower quartiles. Upper quartiles (Q1) constitute a group of respondents that made top 25% while lower quartile (Q3) group represents those respondents that made bottom 25%. We then add the response of each group and divide by the number of the respondents in the group. The difference between the two values obtained gives the discriminative power of the item.
Let use the hypothetical data collected from 1o respondents in scale shown ' below (table 16.51) to demonstrate calculation of discriminative power of a scale item. From the scale, we place all the scores of the ten respondents in the first item in an array, from the lowest to the highest as follows;
5,5,4,3,2,2,2,2,1
The total score = 5 + 5 + 4 + 3 + 2 + 2 + 2 + 2 + 1 = 26
From the scores, 5, 5, and 4 make the top 25% (i.e 14/28 x 1oo = 5o.o%).
Similarly, 2,2 and 1 make the bottom 25% (i.e., 5/28 x 1oo = 17.9%)
The total score in top (Q,) = 5 + 5 + 4 = 14
We divide this score by the number of respondents in the group i.e
14/3 = 4.67
Similarly, the total score in bottom 25% (Q3) = 2 + 2 + 1 = 5
Dividing this number by 3 gave 1.67
DP = 4.67 1.67 = 3.oo
The high value of Discriminative Power (or Index), 3.oo shows that item one in the scale is a good discriminator. Therefore, the item should be retained. Table 16.52 summarizes the calculation of the DP of the first item. Table 16.53 shows the table for the computation of DP of the second item in scale below (table 16.51). A value of o.33 indicated that the second scale item is a poor discriminator. This is because almost all the respondents checked the same response category (strongly agree). Therefore, the scale item should be dropped.
Another approach to DP is to use the measure of Internal constancy (see chapter 23).
Table 16,51Likerl scale representing the responses of 1o respondents on the attitude of Nigerian toward Technical education.

R1 = first respondent \\sqrt = checked \\sqrt R1 = option checked by first respondent SR1 = Score of first respondent
Table 16.52 Table for the compilation of DP of the first item

Where; weighted total = score x number who check that score
Weighted =

Table 16.53 Table for the compilation of DP of the second scale item

4.Selection of Scale items the scale items with high DP values are selected.
5.Test Reliability for testing reliability, we can use test-retest, split-half or Cronbach Alpha (see chapter 23).
16.6Application of Likert Scales
In section 16.31, we used a Likert scale to measure the attitude of a research participant towards technical education. To make such measurement more meaningful, we measure the attitude of two research participants on technical education. Table 16.61 shows a Likert scale that contains the hypothetical scores of two research participants as 18 and 17. From the result of the measurement, we can say that the first research participant has more favourable attitude toward technical education than the second one.
Table 16.61Likert scale for the measurement of attitude of two research participants toward technical education

√ = check for first respondent
x = Check for second respondent
The questionnaire we use for social surveys incorporates Likert scales (see chapter 17).
16.7Controversies over the Construction and the use of Likert Scales
Frankly speaking, Likert scale is the most widely used measuring instrument among social scientists and at the same time, the most controversial scale. In this section we shall look at three areas where researchers differ on what a Likert scale should be and how to interpret results from the scale. The areas are the number of response categories, classification of the scale and interpretation of result from the scale. The aim of this presentation is to enable a beginning researcher to be aware of the controversies surrounding the construction and the use of the scale. | reproduced different opinions concerning Likert scales so that a beginning researcher can make comparison before taking appropriate decision.
Number of response categories
Likert scale consists of series of positively and negatively declarative statements with response categories (options) for each statement. To find the actual number of response categories used by Rensis Likert, we make some references. Polite and Hungler (1995:281) stated that Likert used five categories of agreement-disagreement. They further stated that investigators prefer a seven-point scale, adding the alternatives “slightly agree” and “slightly disagree”. Smith (1988:58) described Likert scale as consisting of a series of positive and negative opinion statements concerning a construct, each accompanied by a five or seven-point response scale. From these two references, we can conclude that Rensis Likert used five-point response scale but researchers later added two response categories, perhaps to make measurement more accurate or reliable.
Any reader of research literature may find the possibility of the use of four or six-point Likert scale. For example;
Atypical Likert scale contains the following options:
Giles (2oo2) reported:

There are a number of variations on this type of response scale. Some scales use 7 options, others 4 or 6. one advantage of using even numbered sets is that respondents are forced to commit themselves to Either a positive or a negative position.
The use of four-point Likert scale means that the undecided category is not used. Therefore, the scale has the following categories “strongly agree”, “agree’ “disagree”, “strongly disagree”. The reason for removing the undecided category’s not far from the fact that how can one weigh or score no response or neutral category
3. To others undecided has a place in the scale, adding that respondents have the right to remain undecided on certain issues. Put it differently, respondent should not be forced to check options against their wish. But, one thing to remember is that even a Likert scale with undecided option is already a force choice scale. To avoid the problem of undecided category many researchers used four-point scale. For example, Imonike (1998) used a four-point scale in her study of measures of improvement of student’s performances in Home Economics in Senior Secondary Certificate Examination in oredo L. G.A of Edo State. The response categories she used were strongly agree, agree, disagree and strongly disagree and weighted as follows;
Strongly agree 4
Agree 3
Disagree 2
Strongly disagree 1
To retain the undecided category and at the same time weight it appropriately, Nworgu (1991:146) modified (proposal) Likert scale as follows;
U SD D A SA
o 1 2 3 4
With this kind of modification, he automatically converts the scale from interval scale to ratio scale. Some of the implications derivable from this kind of modified Likert scale are;
Is it possible to have absolute zero opinion, belief or attitude? Do we really have absolute zero opinion, belief or attitudes on issues?
Disagree opinions is two times stronger than strongly disagree opinion. Similarly, strongly agree opinion is four times strongly disagree opinion. on what basis do we reach such equalities? Furthermore, even the original scale used by Resins Likert may not be an interval scale (we shall see later), let alone modify it to be a ratio.
Polit and Hungler (1995:281) have something to say about undecided category.
There is also a diversity of opinion about the advisability of including an explicit category labeled “uncertain” (undecided). Some researchers argue that the inclusion of this option makes the task less objectionable to people who cannot make their minds or have strong feelings about an issue. others, however, feel that use of this undecided category encourages fence-sitting, or the tendency to not take sides. Investigators who do not give respondents an explicit alternative for indecision or uncertainty proceed in principle as though they were working with five- or seven-point scale, even though only four or six alternatives are given: non response to a given statement is scored as though the neutral response were there and had been chosen.
Use of Likert scale as Interval Scale
Interval scale should have at least two of the following properties.
The categories are rank ordered
The distances between two adjacent categories are equal.
A thermometer graduated in degree Celsius (“C) is an example of an interval scale, it is an interval scale because its categories (25”C, 26”C, 27”C, etc.) are rank ordered. Furthermore, the distance between the two adjacent categories (i.e 26- 25 = 27- 26 = 28 27 = 1°C) is constant. Certainly, the above analysis will enable us to classify Likert scale as ordinal or interval scale. First, we consider the response categories of a Likert scale.
Strongly agree
Agree
Undecided
Disagree
Strongly disagree
One of the conditions to be satisfied by a Likert scale before becoming an interval scale is for the distance between the response (options) categories to be the same, that is, the distance between strongly agree and agree the same as the distance between disagree and strongly disagree.
Nachimas and Nachimas (2oo4:258) reported;
The numerical codes that accompanied these categories are usually interpreted to represent the intensity of the response categories so that the higher the number, the more intense the response. Although we assume that the quantifiers (response categories) involved are ordered by intensity, this does not imply that the distance between the categories is equal. Indeed, rating scales such as these are most often measured on ordinal levels, which only describe whether one level is higher or lower than another level but do not indicate how much higher or lower.
Furthermore, Smith (1998:6o) stated “Likert scales are usually treated as interval measure, although Likert himself originally assumed that they achieved only an ordinal level. The assumption of equal distances between response options should be re-examined each time the researcher employs Likert scales
In his contribution to the debate on likert scale as an interval scale, Achyar (2oo8) explained:
The popularity of likert scale is not without controversy. Whether it is an ordinal or interval is a subject of much debate. Although Rensis likert himself assumed it has an interval scale quality, as it was originally, intended as a summated scale, some considered likert scale is ordinal in nature (Elene and Seaman, 2oo7), and treating it as internal or even ratio, is unclear, if not doubtful (Hodge and Gilliespine, 2oo3); summing ordinal data will not make it interval, only summated ordinal data. Because of the ordinal nature, Elene and Seaman (1997) stated that likert scale is most suitable being analyzed by non-parametric procedure such as frequencies, tabulating chi-squared statistics, Kruskall-Watlis.
Any reader of research literature know that Likert scales are widely used as interval scales. The fundamental question is, do we continue to use Likert scales as interval scale or restrict its use as ordinal scale?
Interpretation of results from Likert Scales
Kalu (2oo2) conducted research on the implementation of continuous assessment in technical courses in Lagos state technical colleges. He used four-point Likert scale and treated the scale as interval scale. In taking decision, he considered a mean of 2.5 and above as successful implementation of continuous assessment in technical courses in technical colleges in Lagos state. on the other hand any mean less than 2.5 was regarded as unsuccessful implementation. Does it mean that a mean of 2.45 rationally represent unsuccessful implementation of continuous assessment?
Note that the researcher use interval scale, generated interval data and interpret the result on nominal scale (i.e., successful or unsuccessful implementation). It is better to use the following interpretation.

Conclusion
Some researchers are with the view that people should not distort Likert scale, adding that whoever is not satisfy with the scale should find another one. Imagine our present aviation industry if Engineers refuse to modify the first aircraft built by Wright brothers. Will there be present sophisticated aeroplanes? Scientific research makes progress if people are allowed to modify the existing scales to suit their peculiar needs. It is with this conviction that I suggest the continuous use of four and six-point scales alongside with five, seven or nine point Likert scales depending on the condition at hand. Furthermore, Likert scale should be treated as interval scale.
Review Question
1a What is a Likert scale?
b Give three examples of a Likertscale.
2. Design a five point six-item Likert scale to measure self-esteem
a Administer the designed scale to 1o respondents and measure the self- esteem of each respondent, b Calculate the discriminative power of all the scale items,
c Decide on the items to be retained and dropped.
References
Giles, D.C. (2oo2). Advanced Research Methods in Psychology. New York: Routledge.
Imonikebe, B. (1998). Measures for Improving Students Performance in Home Economics in Senior Secondary Certificate Examination in oredo LGA of Edo State. Nigerian Journal of Curriculum Studies. Vol 1, No. VII, p. 153–161.
Alu, O. A. (2oo2). The Implementation of Continuous Assessment in Technical Courses in Lagos State Technical Colleges. Unpublished Med thesis. University of Nigeria, Nsukka.
Nachmias, F. and Nachmias, D. (2oo4). Research Methods in Social Sciences. London: Arnold.
Nworgu, B. G. (1991). Educational Research: Basic Tools and Methodology. Ibadan: Wisdom Publishers.
Polit, F. and Hungler, P. (1995). Nursing research: Principle and Methods. Pennsylvania: J. B. Lippincott.
Smith, M. J. (1988). Contemporary Communication Research Methods. Belmont: Wadsworth Publishing Company.

The correlation co-efficient(r) I given by

The computed value of the correlation co-efficient (or stability co-efficient) was found to be +o.98. This high value indicated that the students that did well in the first test also did well in the second test. Similarly, those students that perform moderately in the first test perform moderately in the second test. Therefore, the test is highly stable and therefore reliable.
A researcher who obtained a reliability co-efficient of + o.98 or little below that (say + o.7o) after test retest can go ahead and use his or her test for data collection. But what of a situation where a researcher obtained a co-efficient of reliability of say o.4o? Such a value indicates that the instrument is not stable or reliable. At this point the reader may ask, what make a measuring instrument unreliable? The unreliability of a measuring instrument can be from the poor construction of the instrument’ carelessness of the measurer or the nature of the variable to be measured. Sometime from the nature of the physical condition surrounding the variable. A poorly constructed measuring instrument may contain wrongly worded questions °r ambiguous questions. An ambiguous question for example, can make a respond to respondents to the same question at two different occasions differently (through questioning), thereby making the instrument unreliable. A solution to this problem is to correct the questions that seem to be either wrongly worded or ambiguous. Certainly, such correction will lead to a higher value of reliability co-efficient. Variation in scoring method can also be a source of unreliability of a measuring instrument. A measurer that uses two different scoring methods in test Retest is likely to have a low value of reliability co-efficient.
Poor construction of measuring instrument and variation in scoring method are not the only reasons for unreliability of measuring instruments. Variation of respondent’s attitude, behaviour, mood, and physical condition between two tests can also make an instrument unreliable. It is possible fora respondent to develop a headache, anxiety or to be mentally disorganized before the administration of the test and become okay before the administration of Retest. This situation will definitely render the instrument unreliable. What of the additional knowledge gained after the first test?
Another factor responsible for making an instrument unreliable is the memory interference. If the time between the test and Retest is made short because of the fear of intervening factors there is the possibility of the students to remember the question asked in the first test. A situation that makes the instrument unreliable. This will give higher value of reliability co-efficient.
From the foregoing discussions, we see that the co-efficient of reliability using test Retest technique is time dependent. Time dependent in the sense that short term retest tend to give higher reliability co-efficient while long- term retest give low reliability co-efficient. This implies that test Retest technique is only suitable in the measurement of attributes that do not change within short time. These include; personality, abilities and height among others.
Internal Consistency
The scales for the measurement of concepts or variables usually consist of multiple items. Each of these items is expected to measure the same concept. If the answers or responses to these items are highly associated with one another, the scale or instrument is said to be internally consistent or homogeneous. Three of the most widely used techniques in estimating the internal consistency of instrument will be discussed here.
Split half technique
In this technique, the items in a scale are splited into two groups by flipping of a coin, using odd and even numbers or other random assignment methods. A scale with 2o items can be splited into two groups. If we use odd and even numbers, the two groups will be; 1, 3, 5, 7, 9,11,13,15,17,19 and 2,4, 6,8,1o,12,14,16,18,2o. Each group forms 1o test items. The two tests are administered and the scores are then correlated. A high value of correlation co-efficient indicates that the instrument is internally consistent and therefore reliable.
It is clear that the correlation co-efficient to be computed using split half technique will not represent the entire scale. It represents only 1o item instrument. A situation that underestimate the entire correlation co-efficient of the 2o item test. To estimate the correlation co-efficient of the entire 2o item test we use Spearman Brown prophecy formula.

Where r = the correlation co-efficient computed on the split half r1 = the estimated reliability of the entire test.
If the computed correlation co-efficient for the split half test is o.7, then the estimated reliability for the entire 2o item that will be

We can now see that split half technique has two advantages over the test Retest technique. These advantages are;
The co-efficient of reliability is not affected with time.
It is less expensive than test-retest (i.e use only one test)
However, split half technique is not without problem. The method of splitting test items into two group can give rise to different reliability co-efficient (correlation co-efficient) for the same test. For example, using odd and even method or flipping of a coin on the same test can give different values of reliability co-efficient. Kuder Richardson formula 2o and 21 and Alpha (cronbach alpha) can solve the problem suffered by half split formula
Kuder-Richardson formula 2o
The Kuder - Richardson formula 2o is given by

Where r^ = Estimated Reliability co-efficient
K = number of items in the test
I = summation of
P = the proportion of the test takers who scored items correctly
q = the proportion of test takes who score items wrongly
S2 = variance of the test
Worked example 23.21
Suppose in an attempt to establish the reliability of a measuring instrument (achievement test), a researcher randomly selected 1o subjects and administered the following lost to them.
Atriangle has
A. Two angles B. Five angles C. Three angles D. Four angles
Asquare has
A. Two angles B. Three angles C. Four angles D. Five angles
A Box has
A. Two sides B. Three sides C. Four sides D. Six sides
The total angles of any triangle add up to A. 3o° B. 9o” C. 1oo° D. 18o°
The total angles of a square add up to A. 36o° B. 9o° C. 18o° D. 5o°
Suppose further that after scoring the subjects, the researcher came up with the following results.

Find out whether the research’s test is reliable
Solution
Calculation of ∑ pq
From the first table, the proportion of subjects that answered question 1 correctly
(P1) = ⁸∕₁₀ = o.8
The proportion of subjects that answered the same question wrongly
(q1) = ²∕₁₀= o.2
Note that we can also get o.2 by subtracting o.8 from 1 (ie 1- o.8 = o.2)
Using the same procedure,P2—o.9q2 = o.1
P2—o.8q2 = o.2
P2—o.7q2 = o.3
P2—o.6q2 = o.4
P1 q1 = o.8 x o.2 = o.16
P2 q2 = o.9 x o.1 = o.o9
P3 q3 = o.8 x o.2 = o.16
P4 q4 = o.7 x o.3 = o.21
P5 q5 = o.6 x o.4 = o.24
∑ pq = o.86oo
Calculation of S2
Using equation 23.21

A closer look at this formula will show you that is it simpler than kuder Richardson formula 2o in that computation of ∑pq is eliminated.
Cronbach Alpha
Conbach alpha (α) is a statistic commonly used by researchers as a measure of internal consistency of tests or scales. The statistic was developed by Lee Cronbach in 1951, who named it as alpha. Hence, the name Cronbach Alpha. Cronbach’s (a) is given by

Where K = The total number of items in a test or scale
S21 = The variance of each individual item
S22 = The variance of total test or scale scores
The Cronbach’s estimate reliability can also be based on item correlation. The formula for Cronbach reliability estimate based on item correlation according to Hayes (2oo8) is given by

Where Xji and Xij are elements in covariance or correlation matrix. K is the number of items in a given dimension of a construct. The numerator \\Sigma Xjiindicates that the elements in the diagonal of the covariance or correlation matrix are added together. The denominator \\Sigma Xji+\\Sigma Xij indicates that all the elements in covariance or correlation matrix are added together.
It is important for a reader without sound knowledge on matrix to visit section 32.6 of chapter 32 before proceeding to the application of equation 23.34.
We have already seen in chapter 16 that the calculation of reliability of a questionnaire or scale is one of the phases of questionnaire or scale development. Suppose a researcher wants to develop a questionnaire to measure customer service satisfaction, Customer service satisfaction has three dimensions: satisfaction with availability of service, satisfaction with responsiveness of service and satisfaction with the professionalism of service. Suppose further that the researcher is to measure customer’s satisfaction with the availability of service and consequently generate three items shown in table 23.21. To find the reliability of the questionnaire, the researcher has to administer the questionnaire to randomly selected subjects with the same characteristics with the subjects to be used in his study.
Table 23.21: Questionnaire to measure satisfaction with the availability of Service

Adopted from Hayes (2oo8)
Suppose Fig. 23.22 represents the correlation matrix computed from the data obtained from the administration of the questionnaire in Table 23.22 to subjects

Fig. 23.22: Corelation matrix
We can fined the estimate of the reliablity of the questionnaire using equation 23.24

With this value we can conclude that the questionnaire is reliable.
Remark
We have beenable tocalculate the Cronbach alphamanually simply because we dealt with only three variables. However in real questionnaire construction we normally use many variables (Items). In such a case computation of Cronbach alpha cannot be efficiently done manually. We use computer packages.
Internal Consistency, Dimensionality and Factor Analysis
In the last worked example we computed the Cronbach alpha and found it to be o.94 and concluded that the questionnaire is highly internally consistent and thus reliable. It is reliable in the sense that the value of Cronbach alpha is very high. What of a situation where the Cronbach alpha is small say o.42? An alpha value of o.42 renders the questionnaire unreliable. There are several factors that make a scale or questionnaire unreliable. These include the use of items that are ambiguous or not specific. To achieve higher reliability, one has to modify such items so that they become unambiguous and specific. Another reason that can lower the value of cronbach alpha’ is the presence of items in a scale that measures different dimensions of a concept. To achieve higher value of cronbach alpha, one has to conduct factor analysis (see chapter 32). The result of the analysis will put all the items that measure each particular dimension of a construct together. By this way the scale will have high internal consistency or high value of cronbach alpha, which in turn make it highly reliable.
Equivalence
In collecting data using observation technique, researchers often use two or more observers to rate some people, events, or places. In this case two or more observers using the same instrument to rate the same phenomenon are expected to have similar ratings. If the ratings are similar, the researcher concludes that such instrument is reliable. This kind of reliability is known as Inter observer (Interrater) reliability.
Interrater reliability can be estimated by the use of equivalence co-efficient. To find the equivalence co-efficient, two or more trained observers watch some people characteristics simultaneously and independently and record such Ql”i3P3Ctei’jstics. The characteristics recorded are then correlated to find the correlation co-efficient which is the equivalence co-efficient. A high correlation coefficient signifies that such observational instrument is reliable.
Another way of using the co-efficient of equivalence is in finding the reliability of a multiple choice test. In this case, the researcher construct a multiple choice test and then reversed the order of the responses choice or modify the question wording in minor ways to produce another multiple choice test. The researcher then administers the two tests to same-sample in a quick succession. Finally, the researcher correlate the two scores and find the equivalence co-efficient. A high value of correlation co-efficient show that the test is reliable.
The concept of equivalent is also used in finding the reliability of scales or questionnaires. To find the reliability of a questionnaire for example, a researcher has to generate large set of items that address the same concept or construct and then divide the items (either using random numbers or using even and odd numbers) into two sets. The researcher finally administers the two sets (parallel forms or equivalent forms) to the same sample. The correlation between the two parallel forms is the estimate of the reliability of the scale or questionnaire.
The Cronbach alpha based on parallel form test according to Brown (2oo1) is given by


Adopted from William (2oo6) and modified
(Note that the actual scale did not contain undecided category, I only included it for the sake of clarity).
Suppose further that the table below represents the responses of twenty (2) respondents to the above scale.


We can calculate the reliability of the scale by using equation 23.25. To do so you find:
The total score for odd numbered items of each respondent and put it in column o of the table below.
The total score for even numbered items of each respondent and put it in column E of the table below.
The total score for even numbered items and odd numbered items of each respondent and put it in column T in the table below.
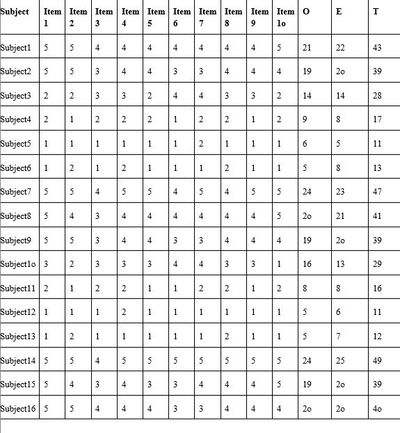
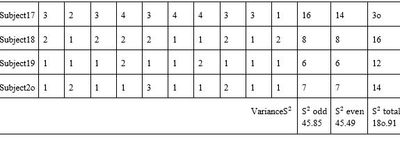


Interpretation of Co-efficient of Reliability
In our previous discussions, we have been talking about the values of corre ation co-efficient. We often say that a high value of correlation co-efficient indicate that the measure or test is reliable. What are the range of values of correlation co-efficient should be consider enough to make a measuring instrument reliable? There is no standard for what an acceptable reliability co-efficient should be. If a researcher is only interested in making group level comparisms, then coefficients in the vicinity of o.7o or even o.6o would probably be sufficient. By group level comparism, we mean that the investigator is interested in comparing the scores of such group as male versus female, smokers versus nonsmokers, experimental versus control and so forth. However, if measures were to be used as a basis for making decisions about individuals, then the reliability co-efficient should be o.9 or better (Polit and Hungler,1995)
23.3 Validity of Measuring Instruments
Quantitative research involves measurement of concepts or indicators of concepts. once the selected concept or indicator is chosen, the next step is to design a measuring instrument to measure it. The designed instrument is supposed to measure what it supposes to measure. The degree or extent to which a measuring instrument measure what it supposed to measure is what is referred to as its validity
To natural scientists the issue of validity is not of much concern. once they decide on the concept or variable to measure the next thing is to use a standard measuring instrument and measure the variable. For example, when a natural scientist wants to measure time, he use stop clock (or stop watch). To measure weight, he uses spring balance. These two measurements are valid with the two instruments However, achievement of valid measurement in social sciences may not be as easy as that of natural sciences (physical sciences). A social scientist may set out to measure one concept and ended of measuring another one. For example he may set out to measure anxiety and ended of measuring depression. Therefore, social Scientist and Educators pay more attention in finding out whether the concept they want to measure is really measured. They do so through four different approaches. These approaches are face validity, content validity, and criterion validity and construct validity.
Face Validity
A measure is said to have a face validity if the items in that measure are related to the phenomenon to be measured. In order words, face validity concerns with the extent to which the measurer believes that the instrument is appropriate in measuring the phenomenon. For example, a questionnaire with a question item that ask the number of houses acquired by a public political office holder within a year in office has a face validity if such questionnaire is designed to measure corruption. A report of high number of houses by the respondent indicates how corrupt he is. on the other hand a questionnaire with a question about the number of civil servant friends made by a public political office holder within one year in office is not likely to have a face validity if it is to measure corruption. The face validity of a measure is established after specialists agree that the items in a measuring instrument are related to the variable to be measured.
Content Validity
Content validity is concerned with sampling adequacy of the content that is being measured. The items in a measure should be representative in type and proportion of the content area. For example, when a teacher taught 1o topics in mathematics, his test questions should represent all the 1o topics. Furthermore, large topics should have more questions than smaller topics. A test with this kind of properties is said to have content validity. When items in a test are representative both in types and proportion of the content area, such a test is said to have high content validity. A test in the hand with some test items that cover topics not taught in the course, ignore or overemphasize certain topics has low validity. one of the practical ways of evaluating the content validity of a test is to systematically compare the test items with a given course content or syllabus or any other reference material.
Criterion Validity
Face validity concerns strictly about whether the measure is related to the phenomenon under investigation. It does not concern about whether the result obtained through an instrument is accurate or not. It is possible for an instrument to have face validity but measure variable inaccurately. For example, a question about the number of bottles of beer one drink in a week has face validity on the measure if ones alcoholic consumption, but may not measure the actual number of the bottles of beer drank by respondent. This is because many heavy drinkers tend to under report the number of bottle of beer drunken on self-report (eg) prequestionnaire minimizing such bias, scientist’s device a means of establishing the validity of self-report and other measuring instrument through the concept of criterion validity. Criterion validity is establish when the scores obtained on one measure can be accurately compare to those obtained with a more direct or already validated measure of the some phenomenon can be validated comparing such measure with that of urine test (criterion).
The criterion validity of a measure can be established in two ways. The first way is to measure the criterion at the same time with the variable to be validated. If e scores of both variables are the same or very closed, the measure is said to have a concurrent validity. The second way of establishing criterion validity is to measure the criterion after the measurement of the variable to be validated. Again, if the two scores are the same or very close, we say that the measure has predictive validity.
Educational measures are also subjected to criterion validity test. For example, a class room teacher may want to find out whether the test given to his students can predict the success or in a future test. If such test predicts either success or failure in future test, such a test is said to have predictive validity. To determine the predictive validity of a test, the teacher has to correlate the scores of the first test with that of the future one (criterion). If there exist a high correlation co-efficient, we conclude that the first test has predictive validity. Sometimes, a teacher may be interested in establishing the concurrent validity of his test. In this case he has administered two test in quick succession to his students and then correlate the scores of the two tests. A high value of correlation co-efficient show that his test has concurrent validity
Construct Validity
Before now we have been talking about validating measuring instrument that measure variables directly. There certain situations in which we have to measure a variable indirectly (through an indicator). If we do so, how are we sure that our Tmoment measure the construct under consideration accurately. one way of verifying this is to examine whether a proposition or theory that is assume to exist is confirmed with the measure from the instrument. Suppose that a researcher developing a new indicator to measure self-esteem. Suppose further that there is a positive relationship between self-esteem and health status. His instrument for measuring self-esteem is said to have construct validity of the measure obtained confirmed the positive relationship between self-esteem and health status.
Review Questions
1 (a) What is meant by the term Reliability of a measuring instrument?
(b) Under what condition a measuring instrument is said to be
(i) Reliable
(ii) Unreliable
2. Describe how you can use test Retest method to determine the co-efficient of reliability of a test.
3.(a) Mention three factors that can cause unreliability of a measuring instrument, (b) Explain any two of them.
4(a) Describe how you can use split half method to measure the reliability coefficient of a measure.
(b) State two advantages of split half method over test Retest method.
5. Under what condition a test is said to have internal consistency?
6(a) Write down the Cronbach’s alpha formula and define all the terms in the formula.
(b) Give one advantage of Cronbach’s alpha formula over split half method.
7. Write short notes on the following types of validity
(i) Face validity
(ii). Content validity
(iii). Criterion validity
(iv) Construct validity
8(a) What do you understand by the term validity of a measuring instrument?
(b) Distinguish between predictive and concurrent validity.